Regions Bank 2011 Annual Report Download - page 128
Download and view the complete annual report
Please find page 128 of the 2011 Regions Bank annual report below. You can navigate through the pages in the report by either clicking on the pages listed below, or by using the keyword search tool below to find specific information within the annual report.-
 1
1 -
2
-
3
-
4
-
5
-
6
-
7
-
8
-
9
-
10
-
11
-
12
-
13
-
14
-
15
-
16
-
17
-
18
-
19
-
20
-
21
-
22
-
23
-
24
-
25
-
26
-
27
-
28
-
29
-
30
-
31
-
32
-
33
-
34
-
35
-
36
-
37
-
38
-
39
-
40
-
41
-
42
-
43
-
44
-
45
-
46
-
47
-
48
-
49
-
50
-
51
-
52
-
53
-
54
-
55
-
56
-
57
-
58
-
59
-
60
-
61
-
62
-
63
-
64
-
65
-
66
-
67
-
68
-
69
-
70
-
71
-
72
-
73
-
74
-
75
-
76
-
77
-
78
-
79
-
80
-
81
-
82
-
83
-
84
-
85
-
86
-
87
-
88
-
89
-
90
-
91
-
92
-
93
-
94
-
95
-
96
-
97
-
98
-
99
-
100
-
101
-
102
-
103
-
104
-
105
-
106
-
107
-
108
-
109
-
110
-
111
-
112
-
113
-
114
-
115
-
116
-
117
-
 118
118 -
 119
119 -
 120
120 -
 121
121 -
 122
122 -
 123
123 -
 124
124 -
 125
125 -
 126
126 -
 127
127 -
 128
128 -
 129
129 -
 130
130 -
 131
131 -
 132
132 -
 133
133 -
 134
134 -
 135
135 -
 136
136 -
 137
137 -
 138
138 -
139
-
140
-
141
-
142
-
143
-
144
-
145
-
146
-
147
-
148
-
149
-
150
-
151
-
152
-
153
-
154
-
155
-
156
-
157
-
158
-
159
-
160
-
161
-
162
-
163
-
164
-
165
-
166
-
167
-
168
-
169
-
170
-
171
-
172
-
173
-
174
-
175
-
176
-
177
-
178
-
179
-
180
-
181
-
182
-
183
-
184
-
185
-
186
-
187
-
188
-
189
-
190
-
191
-
192
-
193
-
194
-
195
-
196
-
197
-
198
-
199
-
200
-
201
-
202
-
203
-
204
-
205
-
206
-
207
-
208
-
209
-
210
-
211
-
212
-
213
-
214
-
215
-
216
-
217
-
218
-
219
-
220
-
221
-
222
-
223
-
224
-
225
-
226
-
227
-
228
-
229
-
230
-
231
-
232
-
233
-
234
-
235
-
236
-
237
-
238
-
239
-
240
-
241
-
242
-
243
-
244
-
245
-
246
-
247
-
248
-
249
-
250
-
251
-
252
-
253
-
254
-
255
-
256
-
257
-
258
-
259
-
260
-
261
-
262
-
263
-
264
-
265
-
266
-
267
-
268
 |
 |

meets the requirement due to the Company’s current cash and investment positions. Should Regions’ cash
position or investment mix change in the future, Regions’ ability to meet the liquidity coverage ratio may be
impacted. Additionally, there is still need for clarification of the Basel III rules as well as interpretation and
implementation by U.S. banking regulators, such that the ultimate impact of Basel III on Regions is not
completely known at this point. Because the Basel III capital calculations are not formally defined by GAAP and
are not currently codified in the federal banking regulations, these measures are considered to be non-GAAP
financial measures, and other entities may calculate them differently than Regions’ disclosed calculations (see
Table 2 “GAAP to Non-GAAP Reconciliation” for further details).
See the “Supervision and Regulation—Capital Requirements” subsection of the “Business” section and the
“Risk Factors” section for more information.
See Note 13 “Regulatory Capital Requirements and Restrictions” to the consolidated financial statements
for further details. As of December 31, 2011, Regions Bank had the requisite capital levels to qualify as well
capitalized.
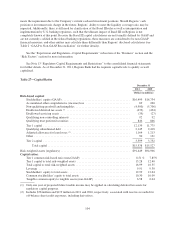
Table 27—Capital Ratios
December 31
2011 2010
(Dollars in millions)
Risk-based capital:
Stockholders’ equity (GAAP) .............................................. $16,499 $16,734
Accumulated other comprehensive (income) loss .............................. 69 260
Non-qualifying goodwill and intangibles ..................................... (4,900) (5,706)
Disallowed deferred tax assets (1) ........................................... (432) (424)
Disallowed servicing assets ................................................ (35) (27)
Qualifying non-controlling interests ......................................... 92 92
Qualifying trust preferred securities ......................................... 846 846
Tier 1 capital ........................................................... 12,139 11,775
Qualifying subordinated debt .............................................. 2,145 2,418
Adjusted allowance for loan losses (2) ........................................ 1,164 1,213
Other ................................................................. 90 121
Tier 2 capital ........................................................... 3,399 3,752
Total capital ........................................................ $15,538 $15,527
Risk-weighted assets (regulatory) ............................................... $91,449 $94,966
Capital ratios:
Tier 1 common risk-based ratio (non-GAAP) ................................. 8.51 % 7.85%
Tier 1 capital to total risk-weighted assets .................................... 13.28 12.40
Total capital to total risk-weighted assets ..................................... 16.99 16.35
Leverage .............................................................. 9.91 9.30
Stockholders’ equity to total assets .......................................... 12.99 12.64
Common stockholders’ equity to total assets .................................. 10.30 10.09
Tangible common equity to tangible assets (non-GAAP) ........................ 6.58 6.04
(1) Only one year of projected future taxable income may be applied in calculating deferred tax assets for
regulatory capital purposes.
(2) Includes $78 million and $119 million in 2011 and 2010, respectively, associated with reserves recorded for
off-balance sheet credit exposures, including derivatives.
104