Regions Bank 2011 Annual Report Download - page 153
Download and view the complete annual report
Please find page 153 of the 2011 Regions Bank annual report below. You can navigate through the pages in the report by either clicking on the pages listed below, or by using the keyword search tool below to find specific information within the annual report.-
 1
1 -
2
-
3
-
4
-
5
-
6
-
7
-
8
-
9
-
10
-
11
-
12
-
13
-
14
-
15
-
16
-
17
-
18
-
19
-
20
-
21
-
22
-
23
-
24
-
25
-
26
-
27
-
28
-
29
-
30
-
31
-
32
-
33
-
34
-
35
-
36
-
37
-
38
-
39
-
40
-
41
-
42
-
43
-
44
-
45
-
46
-
47
-
48
-
49
-
50
-
51
-
52
-
53
-
54
-
55
-
56
-
57
-
58
-
59
-
60
-
61
-
62
-
63
-
64
-
65
-
66
-
67
-
68
-
69
-
70
-
71
-
72
-
73
-
74
-
75
-
76
-
77
-
78
-
79
-
80
-
81
-
82
-
83
-
84
-
85
-
86
-
87
-
88
-
89
-
90
-
91
-
92
-
93
-
94
-
95
-
96
-
97
-
98
-
99
-
100
-
101
-
102
-
103
-
104
-
105
-
106
-
107
-
108
-
109
-
110
-
111
-
112
-
113
-
114
-
115
-
116
-
117
-
118
-
119
-
120
-
121
-
122
-
123
-
124
-
125
-
126
-
127
-
128
-
129
-
130
-
131
-
132
-
133
-
134
-
135
-
136
-
137
-
138
-
139
-
140
-
141
-
142
-
 143
143 -
 144
144 -
 145
145 -
 146
146 -
 147
147 -
 148
148 -
 149
149 -
 150
150 -
 151
151 -
 152
152 -
 153
153 -
 154
154 -
 155
155 -
 156
156 -
 157
157 -
 158
158 -
 159
159 -
 160
160 -
 161
161 -
 162
162 -
 163
163 -
164
-
165
-
166
-
167
-
168
-
169
-
170
-
171
-
172
-
173
-
174
-
175
-
176
-
177
-
178
-
179
-
180
-
181
-
182
-
183
-
184
-
185
-
186
-
187
-
188
-
189
-
190
-
191
-
192
-
193
-
194
-
195
-
196
-
197
-
198
-
199
-
200
-
201
-
202
-
203
-
204
-
205
-
206
-
207
-
208
-
209
-
210
-
211
-
212
-
213
-
214
-
215
-
216
-
217
-
218
-
219
-
220
-
221
-
222
-
223
-
224
-
225
-
226
-
227
-
228
-
229
-
230
-
231
-
232
-
233
-
234
-
235
-
236
-
237
-
238
-
239
-
240
-
241
-
242
-
243
-
244
-
245
-
246
-
247
-
248
-
249
-
250
-
251
-
252
-
253
-
254
-
255
-
256
-
257
-
258
-
259
-
260
-
261
-
262
-
263
-
264
-
265
-
266
-
267
-
268
 |
 |

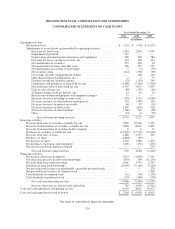
REGIONS FINANCIAL CORPORATION AND SUBSIDIARIES
CONSOLIDATED STATEMENTS OF CASH FLOWS
Year Ended December 31
2011 2010 2009
(In millions)
Operating activities:
Net income (loss) ................................................. $ (215) $ (539) $ (1,031)
Adjustments to reconcile net cash provided by operating activities:
Provision for loan losses ........................................ 1,530 2,863 3,541
Impairment of goodwill ......................................... 745 — —
Depreciation and amortization of premises and equipment ............. 269 284 284
Provision for losses on other real estate, net ......................... 124 168 142
Net amortization of securities .................................... 213 220 10
Net amortization of loans and other assets .......................... 196 233 252
Net amortization (accretion) of borrowings ......................... 5 (5) (19)
Net securities gains ............................................ (112) (394) (69)
Loss (gain) on early extinguishment of debt ......................... — 108 (61)
Other-than-temporary impairments, net ............................ 2 2 75
Deferred income tax (benefit) expense ............................. (23) (210) 245
Originations and purchases of loans held for sale ..................... (3,460) (5,148) (7,409)
Proceeds from sales of loans held for sale .......................... 4,767 5,875 7,650
Gain on sale of loans, net ....................................... (89) (107) (96)
Valuation charges on loans held for sale ............................ 15 45 25
Branch consolidation and property and equipment charges ............. 75 — —
(Increase) decrease in trading account assets ........................ (150) 1,923 (1,989)
Decrease (increase) in other interest-earning assets ................... 134 (485) 163
Decrease (increase) in interest receivable ........................... 60 47 (10)
Decrease (increase) in other assets ................................ 1,107 (876) 462
(Decrease) increase in other liabilities ............................. (366) 224 (90)
Other ....................................................... (74) (1) (38)
Net cash from operating activities ............................. 4,753 4,227 2,037
Investing activities:
Proceeds from sales of securities available for sale ....................... 7,859 10,340 5,451
Proceeds from maturities of securities available for sale ................... 5,848 8,012 5,405
Proceeds from maturities of securities held to maturity .................... 9 6 17
Purchases of securities available for sale ............................... (14,592) (17,701) (15,646)
Proceeds from sales of loans ......................................... 1,488 2,233 645
Purchases of loans ................................................. (1,884) (99) —
Net decrease in loans ............................................... 2,132 1,484 2,443
Net purchases of premises and equipment .............................. (201) (191) (234)
Net cash received from deposits assumed ............................... — — 279
Net cash from investing activities ................................. 659 4,084 (1,640)
Financing activities:
Net increase (decrease) in deposits .................................... 1,013 (4,066) 7,501
Net (decrease) increase in short-term borrowings ......................... (870) 269 (12,154)
Proceeds from long-term borrowings .................................. 1,001 3,743 2,792
Payments on long-term borrowings ................................... (6,004) (9,116) (3,246)
Net proceeds from issuance of mandatorily convertible preferred stock ....... — — 278
Net proceeds from issuance of common stock ........................... — — 1,769
Cash dividends on common stock ..................................... (51) (49) (105)
Cash dividends on preferred stock .................................... (175) (184) (194)
Net cash from financing activities ................................. (5,086) (9,403) (3,359)
Increase (decrease) in cash and cash equivalents ..................... 326 (1,092) (2,962)
Cash and cash equivalents at beginning of year .............................. 6,919 8,011 10,973
Cash and cash equivalents at end of period .................................. $ 7,245 $ 6,919 $ 8,011
See notes to consolidated financial statements.
129