Regions Bank 2011 Annual Report Download - page 192
Download and view the complete annual report
Please find page 192 of the 2011 Regions Bank annual report below. You can navigate through the pages in the report by either clicking on the pages listed below, or by using the keyword search tool below to find specific information within the annual report.-
 1
1 -
2
-
3
-
4
-
5
-
6
-
7
-
8
-
9
-
10
-
11
-
12
-
13
-
14
-
15
-
16
-
17
-
18
-
19
-
20
-
21
-
22
-
23
-
24
-
25
-
26
-
27
-
28
-
29
-
30
-
31
-
32
-
33
-
34
-
35
-
36
-
37
-
38
-
39
-
40
-
41
-
42
-
43
-
44
-
45
-
46
-
47
-
48
-
49
-
50
-
51
-
52
-
53
-
54
-
55
-
56
-
57
-
58
-
59
-
60
-
61
-
62
-
63
-
64
-
65
-
66
-
67
-
68
-
69
-
70
-
71
-
72
-
73
-
74
-
75
-
76
-
77
-
78
-
79
-
80
-
81
-
82
-
83
-
84
-
85
-
86
-
87
-
88
-
89
-
90
-
91
-
92
-
93
-
94
-
95
-
96
-
97
-
98
-
99
-
100
-
101
-
102
-
103
-
104
-
105
-
106
-
107
-
108
-
109
-
110
-
111
-
112
-
113
-
114
-
115
-
116
-
117
-
118
-
119
-
120
-
121
-
122
-
123
-
124
-
125
-
126
-
127
-
128
-
129
-
130
-
131
-
132
-
133
-
134
-
135
-
136
-
137
-
138
-
139
-
140
-
141
-
142
-
143
-
144
-
145
-
146
-
147
-
148
-
149
-
150
-
151
-
152
-
153
-
154
-
155
-
156
-
157
-
158
-
159
-
160
-
161
-
162
-
163
-
164
-
165
-
166
-
167
-
168
-
169
-
170
-
171
-
172
-
173
-
174
-
175
-
176
-
177
-
178
-
179
-
180
-
181
-
 182
182 -
 183
183 -
 184
184 -
 185
185 -
 186
186 -
 187
187 -
 188
188 -
 189
189 -
 190
190 -
 191
191 -
 192
192 -
 193
193 -
 194
194 -
 195
195 -
 196
196 -
 197
197 -
 198
198 -
 199
199 -
 200
200 -
 201
201 -
 202
202 -
203
-
204
-
205
-
206
-
207
-
208
-
209
-
210
-
211
-
212
-
213
-
214
-
215
-
216
-
217
-
218
-
219
-
220
-
221
-
222
-
223
-
224
-
225
-
226
-
227
-
228
-
229
-
230
-
231
-
232
-
233
-
234
-
235
-
236
-
237
-
238
-
239
-
240
-
241
-
242
-
243
-
244
-
245
-
246
-
247
-
248
-
249
-
250
-
251
-
252
-
253
-
254
-
255
-
256
-
257
-
258
-
259
-
260
-
261
-
262
-
263
-
264
-
265
-
266
-
267
-
268
 |
 |

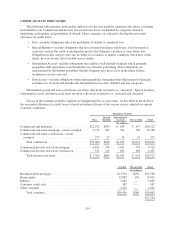
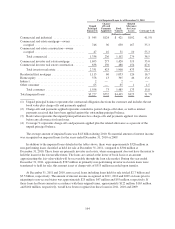
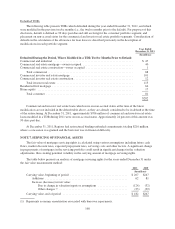
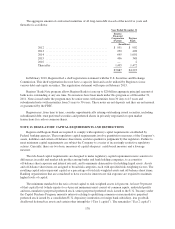
Defaulted TDRs
The following table presents TDRs which defaulted during the year ended December 31, 2011, and which
were modified in the previous twelve months (i.e., the twelve months prior to the default). For purposes of this
disclosure, default is defined as 90 days past due and still accruing for the consumer portfolio segment, and
placement on non-accrual status for the commercial and investor real estate portfolio segments. Consideration of
defaults in the calculation of the allowance for loan losses is described previously in the description of
modifications in each portfolio segment.
Year Ended
December 31, 2011
(In millions)
Defaulted During the Period, Where Modified in a TDR Twelve Months Prior to Default
Commercial and industrial ...................................................... $ 47
Commercial real estate mortgage—owner occupied .................................. 40
Commercial real estate construction—owner occupied ................................ 1
Total commercial .......................................................... 88
Commercial investor real estate mortgage .......................................... 101
Commercial investor real estate construction ........................................ 12
Total investor real estate .................................................... 113
Residential first mortgage ....................................................... 64
Home equity ................................................................. 17
Total consumer ........................................................... 81
$282
Commercial and investor real estate loans which were on non-accrual status at the time of the latest
modification are not included in the default table above, as they are already considered to be in default at the time
of the restructuring. At December 31, 2011, approximately $706 million of commercial and investor real estate
loans modified in a TDR during 2011 were on non-accrual status. Approximately 24 percent of this amount was
90 days past due.
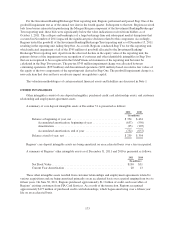
At December 31, 2011, Regions had restructured binding unfunded commitments totaling $210 million
where a concession was granted and the borrower was in financial difficulty.
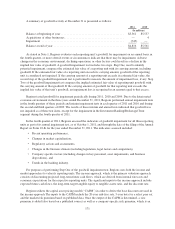
NOTE 7. SERVICING OF FINANCIAL ASSETS
The fair value of mortgage servicing rights is calculated using various assumptions including future cash
flows, market discount rates, expected prepayment rates, servicing costs and other factors. A significant change
in prepayments of mortgages in the servicing portfolio could result in significant changes in the valuation
adjustments, thus creating potential volatility in the carrying amount of mortgage servicing rights.
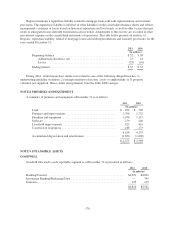
The table below presents an analysis of mortgage servicing rights for the years ended December 31 under
the fair value measurement method:
2011 2010
(In millions)
Carrying value, beginning of period ....................................... $267 $247
Additions ........................................................ 62 81
Increase (decrease) in fair value:
Due to change in valuation inputs or assumptions .................... (124) (32)
Other changes (1) ............................................... (23) (29)
Carrying value, end of period ............................................ $182 $267
(1) Represents economic amortization associated with borrower repayments.
168