Regions Bank 2011 Annual Report Download - page 71
Download and view the complete annual report
Please find page 71 of the 2011 Regions Bank annual report below. You can navigate through the pages in the report by either clicking on the pages listed below, or by using the keyword search tool below to find specific information within the annual report.-
 1
1 -
2
-
3
-
4
-
5
-
6
-
7
-
8
-
9
-
10
-
11
-
12
-
13
-
14
-
15
-
16
-
17
-
18
-
19
-
20
-
21
-
22
-
23
-
24
-
25
-
26
-
27
-
28
-
29
-
30
-
31
-
32
-
33
-
34
-
35
-
36
-
37
-
38
-
39
-
40
-
41
-
42
-
43
-
44
-
45
-
46
-
47
-
48
-
49
-
50
-
51
-
52
-
53
-
54
-
55
-
56
-
57
-
58
-
59
-
60
-
 61
61 -
 62
62 -
 63
63 -
 64
64 -
 65
65 -
 66
66 -
 67
67 -
 68
68 -
 69
69 -
 70
70 -
 71
71 -
 72
72 -
 73
73 -
 74
74 -
 75
75 -
 76
76 -
 77
77 -
 78
78 -
 79
79 -
 80
80 -
 81
81 -
82
-
83
-
84
-
85
-
86
-
87
-
88
-
89
-
90
-
91
-
92
-
93
-
94
-
95
-
96
-
97
-
98
-
99
-
100
-
101
-
102
-
103
-
104
-
105
-
106
-
107
-
108
-
109
-
110
-
111
-
112
-
113
-
114
-
115
-
116
-
117
-
118
-
119
-
120
-
121
-
122
-
123
-
124
-
125
-
126
-
127
-
128
-
129
-
130
-
131
-
132
-
133
-
134
-
135
-
136
-
137
-
138
-
139
-
140
-
141
-
142
-
143
-
144
-
145
-
146
-
147
-
148
-
149
-
150
-
151
-
152
-
153
-
154
-
155
-
156
-
157
-
158
-
159
-
160
-
161
-
162
-
163
-
164
-
165
-
166
-
167
-
168
-
169
-
170
-
171
-
172
-
173
-
174
-
175
-
176
-
177
-
178
-
179
-
180
-
181
-
182
-
183
-
184
-
185
-
186
-
187
-
188
-
189
-
190
-
191
-
192
-
193
-
194
-
195
-
196
-
197
-
198
-
199
-
200
-
201
-
202
-
203
-
204
-
205
-
206
-
207
-
208
-
209
-
210
-
211
-
212
-
213
-
214
-
215
-
216
-
217
-
218
-
219
-
220
-
221
-
222
-
223
-
224
-
225
-
226
-
227
-
228
-
229
-
230
-
231
-
232
-
233
-
234
-
235
-
236
-
237
-
238
-
239
-
240
-
241
-
242
-
243
-
244
-
245
-
246
-
247
-
248
-
249
-
250
-
251
-
252
-
253
-
254
-
255
-
256
-
257
-
258
-
259
-
260
-
261
-
262
-
263
-
264
-
265
-
266
-
267
-
268
 |
 |
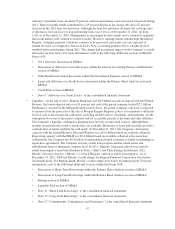
indicator of problem loans, declined 35 percent, and non-performing assets decreased 24 percent during
2011. These favorable trends contributed to a 29 percent decline in net charge-offs and a 47 percent
decrease in the 2011 loan loss provision. Although the loan loss provision declined, the coverage ratio
of allowance for loan losses to non-performing loans was 1.16x as of December 31, 2011, up from
1.01x as of December 31, 2010. Management is encouraged by these trends and is cautiously optimistic
that credit metrics will continue to trend favorably. However, unemployment remains high throughout
Regions’ footprint, property valuations continue to be pressured, and credit costs are expected to
remain elevated, as compared to historical levels. New accounting guidance led to a higher level of
troubled debt restructurings during 2011. The change had no material impact on the Company’s overall
allowance for loan losses. For more information, refer to the following additional sections within this
Form 10-K:
• 2011 Overview discussion in MD&A
• Discussion of Allowance for Credit Losses within the Critical Accounting Policies and Estimates
section of MD&A
• Other Real Estate Owned discussion within the Non-Interest Expense section of MD&A
• Loans and Allowance for Credit Losses discussion within the Balance Sheet Analysis section of
MD&A
• Credit Risk section of MD&A
• Note 6 “Allowance for Credit Losses” to the consolidated financial statements
• Liquidity—At the end of 2011, Regions Bank had over $4.9 billion in cash on deposit with the Federal
Reserve, the loan-to-deposit ratio was 81 percent and cash at the parent company totaled $2.5 billion.
Furthermore, as noted in the Morgan Keegan section above, the parent company cash level is expected
to increase from the proceeds of the sale of Morgan Keegan. Regions’ policy is to maintain a sufficient
level of cash to meet projected cash needs, including all debt service, dividends, and maturities, for the
subsequent two years at the parent company and for acceptable periods at the bank and other affiliates.
The Company’s liquidity contingency planning does not rely on unsecured sources, although these
markets are periodically tested to ensure they are available. Maturities of loans and securities provide a
constant flow of funds available for cash needs. At December 31, 2011, the Company’s borrowing
capacity with the Federal Reserve Discount Window was $19.4 billion based on available collateral.
Borrowing capacity with the FHLB was $5.4 billion based on available collateral at the same date.
Additionally, the Company has $9.9 billion of unencumbered liquid securities available for pledging or
repurchase agreements. The Company also has a bank note program and has issued senior and
subordinated notes at the parent company level. In 2011, Regions’ long-term outlook was raised to
stable from negative from both Standard & Poors (“S&P”) and Fitch Ratings. In February 2012,
Moody’s Investors Service (“Moody’s”) revised Regions’ outlook to stable from negative. As of
December 31, 2011, S&P and Moody’s credit ratings for Regions Financial Corporation were below
investment grade. For Regions Bank, Moody’s credit ratings were below investment grade. For more
information, refer to the following additional sections within this Form 10-K:
• Discussion of Short-Term Borrowings within the Balance Sheet Analysis section of MD&A
• Discussion of Long-Term Borrowings within the Balance Sheet Analysis section of MD&A
• Ratings section of MD&A
• Liquidity Risk section of MD&A
• Note 11 “Short-Term Borrowings” to the consolidated financial statements
• Note 12 “Long-Term Borrowings” to the consolidated financial statements
• Note 23 “Commitments, Contingencies and Guarantees” to the consolidated financial statements
47