Regions Bank 2011 Annual Report Download - page 234
Download and view the complete annual report
Please find page 234 of the 2011 Regions Bank annual report below. You can navigate through the pages in the report by either clicking on the pages listed below, or by using the keyword search tool below to find specific information within the annual report.-
 1
1 -
2
-
3
-
4
-
5
-
6
-
7
-
8
-
9
-
10
-
11
-
12
-
13
-
14
-
15
-
16
-
17
-
18
-
19
-
20
-
21
-
22
-
23
-
24
-
25
-
26
-
27
-
28
-
29
-
30
-
31
-
32
-
33
-
34
-
35
-
36
-
37
-
38
-
39
-
40
-
41
-
42
-
43
-
44
-
45
-
46
-
47
-
48
-
49
-
50
-
51
-
52
-
53
-
54
-
55
-
56
-
57
-
58
-
59
-
60
-
61
-
62
-
63
-
64
-
65
-
66
-
67
-
68
-
69
-
70
-
71
-
72
-
73
-
74
-
75
-
76
-
77
-
78
-
79
-
80
-
81
-
82
-
83
-
84
-
85
-
86
-
87
-
88
-
89
-
90
-
91
-
92
-
93
-
94
-
95
-
96
-
97
-
98
-
99
-
100
-
101
-
102
-
103
-
104
-
105
-
106
-
107
-
108
-
109
-
110
-
111
-
112
-
113
-
114
-
115
-
116
-
117
-
118
-
119
-
120
-
121
-
122
-
123
-
124
-
125
-
126
-
127
-
128
-
129
-
130
-
131
-
132
-
133
-
134
-
135
-
136
-
137
-
138
-
139
-
140
-
141
-
142
-
143
-
144
-
145
-
146
-
147
-
148
-
149
-
150
-
151
-
152
-
153
-
154
-
155
-
156
-
157
-
158
-
159
-
160
-
161
-
162
-
163
-
164
-
165
-
166
-
167
-
168
-
169
-
170
-
171
-
172
-
173
-
174
-
175
-
176
-
177
-
178
-
179
-
180
-
181
-
182
-
183
-
184
-
185
-
186
-
187
-
188
-
189
-
190
-
191
-
192
-
193
-
194
-
195
-
196
-
197
-
198
-
199
-
200
-
201
-
202
-
203
-
204
-
205
-
206
-
207
-
208
-
209
-
210
-
211
-
212
-
213
-
214
-
215
-
216
-
217
-
218
-
219
-
220
-
221
-
222
-
223
-
 224
224 -
 225
225 -
 226
226 -
 227
227 -
 228
228 -
 229
229 -
 230
230 -
 231
231 -
 232
232 -
 233
233 -
 234
234 -
 235
235 -
 236
236 -
 237
237 -
 238
238 -
 239
239 -
 240
240 -
 241
241 -
 242
242 -
 243
243 -
 244
244 -
245
-
246
-
247
-
248
-
249
-
250
-
251
-
252
-
253
-
254
-
255
-
256
-
257
-
258
-
259
-
260
-
261
-
262
-
263
-
264
-
265
-
266
-
267
-
268
 |
 |

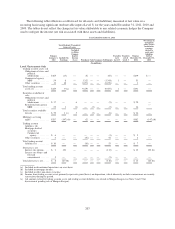
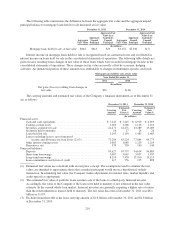
The following table summarizes the difference between the aggregate fair value and the aggregate unpaid
principal balance for mortgage loans held for sale measured at fair value:
December 31, 2011 December 31, 2010
Aggregate
Fair Value
Aggregate
Unpaid
Principal
Aggregate Fair
Value Less
Aggregate
Unpaid
Principal
Aggregate
Fair Value
Aggregate
Unpaid
Principal
Aggregate Fair
Value Less
Aggregate
Unpaid
Principal
(In millions)
Mortgage loans held for sale, at fair value $844 $815 $29 $1,174 $1,181 $(7)
Interest income on mortgage loans held for sale is recognized based on contractual rates and is reflected in
interest income on loans held for sale in the consolidated statements of operations. The following table details net
gains (losses) resulting from changes in fair value of these loans which were recorded in mortgage income in the
consolidated statements of operations. These changes in fair value are mostly offset by economic hedging
activities. An immaterial portion of these amounts was attributable to changes in instrument-specific credit risk.
Mortgage loans held for sale, at fair value
Year Ended December 31
2011 2010
(In millions)
Net gains (losses) resulting from changes in
fair value ............................ $36 $(14)
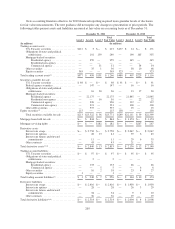
The carrying amounts and estimated fair values of the Company’s financial instruments as of December 31
are as follows:
December 31, 2011 December 31, 2010
Carrying
Amount
Estimated
Fair
Value(1)
Carrying
Amount
Estimated
Fair
Value(1)
(In millions)
Financial assets:
Cash and cash equivalents .................................. $ 7,245 $ 7,245 $ 6,919 $ 6,919
Trading account assets ..................................... 1,266 1,266 1,116 1,116
Securities available for sale ................................. 24,471 24,471 23,289 23,289
Securities held to maturity .................................. 16 17 24 26
Loans held for sale ........................................ 1,193 1,193 1,485 1,485
Loans (excluding leases), net of unearned ......................
income and allowance for loan losses (2),(3) ................ 73,284 65,224 77,864 69,775
Other interest-earning assets ................................ 1,085 1,085 1,219 1,219
Derivatives, net ........................................... 339 339 140 140
Financial liabilities:
Deposits ................................................ 95,627 95,757 94,614 94,883
Short-term borrowings ..................................... 3,067 3,067 3,937 3,937
Long-term borrowings ..................................... 8,110 7,439 13,190 13,115
Loan commitments and letters of credit ........................ 117 756 125 899
(1) Estimated fair values are consistent with an exit price concept. The assumptions used to estimate the fair
values are intended to approximate those that a market participant would use in a hypothetical orderly
transaction. In estimating fair value, the Company makes adjustments for interest rates, market liquidity and
credit spreads as appropriate.
(2) The estimated fair value of portfolio loans assumes sale of the loans to a third-party financial investor.
Accordingly, the value to the Company if the loans were held to maturity is not reflected in the fair value
estimate. In the current whole loan market, financial investors are generally requiring a higher rate of return
than the return inherent in loans if held to maturity. The fair value discount at December 31, 2011 was $8.1
billion or 11.0%.
(3) Excluded from this table is the lease carrying amount of $1.6 billion at December 31, 2011 and $1.8 billion
at December 31, 2010.
210