Regions Bank 2011 Annual Report Download - page 76
Download and view the complete annual report
Please find page 76 of the 2011 Regions Bank annual report below. You can navigate through the pages in the report by either clicking on the pages listed below, or by using the keyword search tool below to find specific information within the annual report.-
 1
1 -
2
-
3
-
4
-
5
-
6
-
7
-
8
-
9
-
10
-
11
-
12
-
13
-
14
-
15
-
16
-
17
-
18
-
19
-
20
-
21
-
22
-
23
-
24
-
25
-
26
-
27
-
28
-
29
-
30
-
31
-
32
-
33
-
34
-
35
-
36
-
37
-
38
-
39
-
40
-
41
-
42
-
43
-
44
-
45
-
46
-
47
-
48
-
49
-
50
-
51
-
52
-
53
-
54
-
55
-
56
-
57
-
58
-
59
-
60
-
61
-
62
-
63
-
64
-
65
-
 66
66 -
 67
67 -
 68
68 -
 69
69 -
 70
70 -
 71
71 -
 72
72 -
 73
73 -
 74
74 -
 75
75 -
 76
76 -
 77
77 -
 78
78 -
 79
79 -
 80
80 -
 81
81 -
 82
82 -
 83
83 -
 84
84 -
 85
85 -
 86
86 -
87
-
88
-
89
-
90
-
91
-
92
-
93
-
94
-
95
-
96
-
97
-
98
-
99
-
100
-
101
-
102
-
103
-
104
-
105
-
106
-
107
-
108
-
109
-
110
-
111
-
112
-
113
-
114
-
115
-
116
-
117
-
118
-
119
-
120
-
121
-
122
-
123
-
124
-
125
-
126
-
127
-
128
-
129
-
130
-
131
-
132
-
133
-
134
-
135
-
136
-
137
-
138
-
139
-
140
-
141
-
142
-
143
-
144
-
145
-
146
-
147
-
148
-
149
-
150
-
151
-
152
-
153
-
154
-
155
-
156
-
157
-
158
-
159
-
160
-
161
-
162
-
163
-
164
-
165
-
166
-
167
-
168
-
169
-
170
-
171
-
172
-
173
-
174
-
175
-
176
-
177
-
178
-
179
-
180
-
181
-
182
-
183
-
184
-
185
-
186
-
187
-
188
-
189
-
190
-
191
-
192
-
193
-
194
-
195
-
196
-
197
-
198
-
199
-
200
-
201
-
202
-
203
-
204
-
205
-
206
-
207
-
208
-
209
-
210
-
211
-
212
-
213
-
214
-
215
-
216
-
217
-
218
-
219
-
220
-
221
-
222
-
223
-
224
-
225
-
226
-
227
-
228
-
229
-
230
-
231
-
232
-
233
-
234
-
235
-
236
-
237
-
238
-
239
-
240
-
241
-
242
-
243
-
244
-
245
-
246
-
247
-
248
-
249
-
250
-
251
-
252
-
253
-
254
-
255
-
256
-
257
-
258
-
259
-
260
-
261
-
262
-
263
-
264
-
265
-
266
-
267
-
268
 |
 |
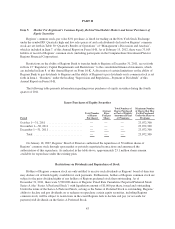
2011 OVERVIEW
Regions reported a net loss available to common shareholders of $429 million or $0.34 per diluted common
share in 2011. A significant driver of 2011 results was a $731 million (net of $14 million income tax impact)
goodwill impairment charge related to the Company’s Investment Banking/Brokerage/Trust segment, resulting
from the process of selling Morgan Keegan. This impairment charge included $478 million related to
discontinued operations and $253 million from continuing operations. Another significant driver of 2011 results
included a $44 million income tax benefit related to a regulatory settlement, of which approximately $17 million
was associated with continuing operations and $27 million with discontinued operations. Excluding these two
items, Regions’ income from continuing operations available to common shareholders was $211 million or $0.17
per diluted common share in 2011. See Table 2 “GAAP to Non-GAAP Reconciliation”. Credit-related costs,
primarily the loan loss provision, declined significantly in 2011 as a result of improvements in the credit
environment. Average low-cost deposits grew 5 percent leading to a decline in both 2011’s total deposit and
funding costs.
Net interest income from continuing operations remained stable at $3.4 billion in 2011. The net interest
margin (fully-taxable equivalent basis) was 3.07 percent in 2011, compared to 2.91 percent during 2010,
primarily due to a reduction in average earning assets. Net interest income was driven primarily by a decrease of
34 basis points in the cost of interest-bearing liabilities, while being partially offset by a 15 basis point decline in
the overall yield on interest earning assets. This dynamic reflected efforts to improve deposit costs and pricing on
loans, while managing the challenges posed by a low interest rate environment. Long-term interest rates in
particular remained low in 2011, pressuring yields on fixed-rate loan and securities portfolios, and contributed to
the decline in the yield on taxable securities from 3.66 percent in 2010 to 3.08 percent in 2011. The overall costs
of deposits improved from 0.78 percent in 2010 to 0.49 percent in 2011, as short-term interest rates (for example,
the Federal Funds rate) remained at historical lows. The product mix of deposits improved as well, as declines in
higher cost certificates of deposits accompanied increases in low cost checking and savings products.
Although the net interest margin from continuing operations increased in 2011, the factors that have
pressured it are likely to persist. These factors include a continuation of persistent, low level of interest rates,
elevated non-performing asset levels and costs associated with managing prudent levels of liquidity. However,
management expects to see incremental improvement in net interest income and the resulting net interest margin
in 2012 as the amount of excess cash reserves and non-performing assets continue to decline. Furthermore,
Regions’ balance sheet is in an asset sensitive position such that if economic conditions were to improve more
rapidly, thereby resulting in a rise in interest rates, the net interest margin would likely respond favorably.
Net charge-offs totaled $2.0 billion, or 2.44 percent of average loans in 2011 compared to $2.8 billion, or
3.22 percent of average loans in 2010. Net charge-offs were lower across most major categories when comparing
2011 to the prior year. Non-performing assets decreased $922 million from December 31, 2010 to December 31,
2011 to $3.0 billion.
The provision for loan losses is used to maintain the allowance for loan losses at a level that, in
management’s judgment, is appropriate to cover losses inherent in the loan portfolio as of the balance sheet date.
During 2011, the provision for loan losses decreased to $1.5 billion compared to $2.9 billion in 2010. The
allowance for loan losses was $2.7 billion, or 3.54 percent of loans, at December 31, 2011 as compared to $3.2
billion, or 3.84 percent of loans, at December 31, 2010. Net charge-offs exceeded provision for loan losses for
2011. This relationship resulted from the allowance associated with loans transferred to held for sale and
improving consumer credit trends. Credit metrics, including non-accrual, criticized and classified loan balances,
and delinquencies showed continued improving trends.
Non-interest income from continuing operations decreased to $2.1 billion in 2011 from $2.5 billion in 2010.
The year-over-year decrease was due primarily to lower securities gains and leveraged lease termination gains, as
well as a decline in mortgage income. However, service charges income was relatively stable in 2011 compared
to 2010, despite the impact of Regulation E and the Durbin Amendment. See Table 2 “GAAP to Non-GAAP
Reconciliation” and Table 5 “Non-Interest Income” for further details.
52