Regions Bank 2011 Annual Report Download - page 86
Download and view the complete annual report
Please find page 86 of the 2011 Regions Bank annual report below. You can navigate through the pages in the report by either clicking on the pages listed below, or by using the keyword search tool below to find specific information within the annual report.-
 1
1 -
2
-
3
-
4
-
5
-
6
-
7
-
8
-
9
-
10
-
11
-
12
-
13
-
14
-
15
-
16
-
17
-
18
-
19
-
20
-
21
-
22
-
23
-
24
-
25
-
26
-
27
-
28
-
29
-
30
-
31
-
32
-
33
-
34
-
35
-
36
-
37
-
38
-
39
-
40
-
41
-
42
-
43
-
44
-
45
-
46
-
47
-
48
-
49
-
50
-
51
-
52
-
53
-
54
-
55
-
56
-
57
-
58
-
59
-
60
-
61
-
62
-
63
-
64
-
65
-
66
-
67
-
68
-
69
-
70
-
71
-
72
-
73
-
74
-
75
-
 76
76 -
 77
77 -
 78
78 -
 79
79 -
 80
80 -
 81
81 -
 82
82 -
 83
83 -
 84
84 -
 85
85 -
 86
86 -
 87
87 -
 88
88 -
 89
89 -
 90
90 -
 91
91 -
 92
92 -
 93
93 -
 94
94 -
 95
95 -
 96
96 -
97
-
98
-
99
-
100
-
101
-
102
-
103
-
104
-
105
-
106
-
107
-
108
-
109
-
110
-
111
-
112
-
113
-
114
-
115
-
116
-
117
-
118
-
119
-
120
-
121
-
122
-
123
-
124
-
125
-
126
-
127
-
128
-
129
-
130
-
131
-
132
-
133
-
134
-
135
-
136
-
137
-
138
-
139
-
140
-
141
-
142
-
143
-
144
-
145
-
146
-
147
-
148
-
149
-
150
-
151
-
152
-
153
-
154
-
155
-
156
-
157
-
158
-
159
-
160
-
161
-
162
-
163
-
164
-
165
-
166
-
167
-
168
-
169
-
170
-
171
-
172
-
173
-
174
-
175
-
176
-
177
-
178
-
179
-
180
-
181
-
182
-
183
-
184
-
185
-
186
-
187
-
188
-
189
-
190
-
191
-
192
-
193
-
194
-
195
-
196
-
197
-
198
-
199
-
200
-
201
-
202
-
203
-
204
-
205
-
206
-
207
-
208
-
209
-
210
-
211
-
212
-
213
-
214
-
215
-
216
-
217
-
218
-
219
-
220
-
221
-
222
-
223
-
224
-
225
-
226
-
227
-
228
-
229
-
230
-
231
-
232
-
233
-
234
-
235
-
236
-
237
-
238
-
239
-
240
-
241
-
242
-
243
-
244
-
245
-
246
-
247
-
248
-
249
-
250
-
251
-
252
-
253
-
254
-
255
-
256
-
257
-
258
-
259
-
260
-
261
-
262
-
263
-
264
-
265
-
266
-
267
-
268
 |
 |
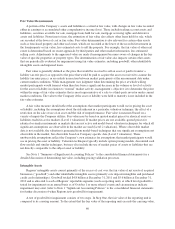
assets to fair value, exceeded any reductions in the value of common equity determined in Step One; accordingly
the calculation of implied goodwill exceeded its carrying amount. Therefore, the results were no impairment for
the Banking/Treasury reporting unit, whose implied fair value of goodwill exceeded its carrying amount by
approximately 12 percent as of October 1, 2011 compared to approximately 29 percent as of fourth quarter 2010.
Since the third quarter of 2009, the fair values of net assets and liabilities of the Banking/Treasury reporting unit
have increased faster than the fair value of equity of this reporting unit. Should the fair values of net assets
continue to increase more rapidly than the fair value of this reporting unit, goodwill could be impaired in future
periods.
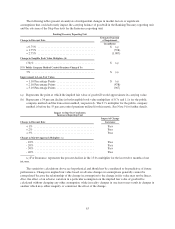
During the third and fourth quarters of 2011, Regions experienced a significant decline in market
capitalization relative to prior periods. The large-cap banking sector also experienced a decline in market
capitalization albeit not as significant as that of Regions. This resulted in price-to-tangible book values declining
and resulted in an overall value conclusion for the Banking/Treasury reporting unit that would be indicative of a
distressed sale in the public company method. Accordingly, Regions increased the control premium utilized in
the public company method from 30 percent in 2010 to 55 percent in the test conducted in the fourth quarter of
2011. The higher control premium was evidenced by market transactions occurring in 2010. See attached
sensitivity tables for additional information.
For the Investment Banking/Brokerage/Trust reporting unit, Regions performed and passed Step One of the
goodwill impairment test as of the annual test date in the fourth quarter of 2011. Subsequent to that test, Regions
received bids later in the fourth quarter from buyers interested in purchasing the Morgan Keegan component of
the Investment Banking/Brokerage/Trust reporting unit; these bids were significantly below the value indications
received from bidders as of October 1, 2011. The collapse and bankruptcy of a large brokerage firm and
subsequent market disruptions that occurred in November of 2011 as a result impacted the significant price
declines related to this component. Accordingly, Regions tested the goodwill of the Investment Banking/
Brokerage/Trust reporting unit as of December 15, 2011, resulting in the reporting unit failing Step One. As a
result, Regions conducted Step Two for this reporting unit, which indicated impairment of all of the $745 million
of goodwill allocated to the Investment Banking/Brokerage/Trust reporting unit. Apart from the observed decline
in the equity value of the reporting unit, the primary drivers of the impairment were recognition of customer and
other identifiable intangibles in Step Two that are not required to be recognized in the GAAP financial
statements of the reporting unit that must be calculated in the Step Two in the goodwill impairment test. The
pre-tax $745 million impairment charge was allocated between continuing operations ($253 million) and
discontinued operations ($492 million) based on relative fair values of the equity of the two components of the
reporting unit. The goodwill impairment charge is a non-cash item that does not have an adverse impact on
regulatory capital.
Specific factors as of the date of filing the financial statements that could negatively impact the assumptions
used in assessing goodwill for impairment include: a protracted decline in the Company’s market capitalization,
disparities in the level of fair value changes in net assets compared to equity, adverse business trends resulting
from litigation and/or regulatory actions, higher loan losses, lengthened forecasts of higher unemployment
relative to pre-crisis levels beyond 2013, future increased minimum regulatory capital requirements above
current thresholds (refer to Note 13 “Regulatory Capital Requirements and Restrictions” for a discussion of
current minimum regulatory requirements), future federal rules and regulations resulting from the Dodd-Frank
Act, and/or a protraction in the current low level of interest rates significantly beyond 2014.
62