Regions Bank 2011 Annual Report Download - page 158
Download and view the complete annual report
Please find page 158 of the 2011 Regions Bank annual report below. You can navigate through the pages in the report by either clicking on the pages listed below, or by using the keyword search tool below to find specific information within the annual report.-
 1
1 -
2
-
3
-
4
-
5
-
6
-
7
-
8
-
9
-
10
-
11
-
12
-
13
-
14
-
15
-
16
-
17
-
18
-
19
-
20
-
21
-
22
-
23
-
24
-
25
-
26
-
27
-
28
-
29
-
30
-
31
-
32
-
33
-
34
-
35
-
36
-
37
-
38
-
39
-
40
-
41
-
42
-
43
-
44
-
45
-
46
-
47
-
48
-
49
-
50
-
51
-
52
-
53
-
54
-
55
-
56
-
57
-
58
-
59
-
60
-
61
-
62
-
63
-
64
-
65
-
66
-
67
-
68
-
69
-
70
-
71
-
72
-
73
-
74
-
75
-
76
-
77
-
78
-
79
-
80
-
81
-
82
-
83
-
84
-
85
-
86
-
87
-
88
-
89
-
90
-
91
-
92
-
93
-
94
-
95
-
96
-
97
-
98
-
99
-
100
-
101
-
102
-
103
-
104
-
105
-
106
-
107
-
108
-
109
-
110
-
111
-
112
-
113
-
114
-
115
-
116
-
117
-
118
-
119
-
120
-
121
-
122
-
123
-
124
-
125
-
126
-
127
-
128
-
129
-
130
-
131
-
132
-
133
-
134
-
135
-
136
-
137
-
138
-
139
-
140
-
141
-
142
-
143
-
144
-
145
-
146
-
147
-
 148
148 -
 149
149 -
 150
150 -
 151
151 -
 152
152 -
 153
153 -
 154
154 -
 155
155 -
 156
156 -
 157
157 -
 158
158 -
 159
159 -
 160
160 -
 161
161 -
 162
162 -
 163
163 -
 164
164 -
 165
165 -
 166
166 -
 167
167 -
 168
168 -
169
-
170
-
171
-
172
-
173
-
174
-
175
-
176
-
177
-
178
-
179
-
180
-
181
-
182
-
183
-
184
-
185
-
186
-
187
-
188
-
189
-
190
-
191
-
192
-
193
-
194
-
195
-
196
-
197
-
198
-
199
-
200
-
201
-
202
-
203
-
204
-
205
-
206
-
207
-
208
-
209
-
210
-
211
-
212
-
213
-
214
-
215
-
216
-
217
-
218
-
219
-
220
-
221
-
222
-
223
-
224
-
225
-
226
-
227
-
228
-
229
-
230
-
231
-
232
-
233
-
234
-
235
-
236
-
237
-
238
-
239
-
240
-
241
-
242
-
243
-
244
-
245
-
246
-
247
-
248
-
249
-
250
-
251
-
252
-
253
-
254
-
255
-
256
-
257
-
258
-
259
-
260
-
261
-
262
-
263
-
264
-
265
-
266
-
267
-
268
 |
 |
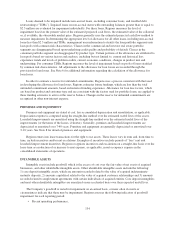
Loans deemed to be impaired include non-accrual loans, excluding consumer loans, and troubled debt
restructurings (“TDRs”). Impaired loans on non-accrual status with outstanding balances greater than or equal to
$2.5 million are evaluated for impairment individually. For these loans, Regions measures the level of
impairment based on the present value of the estimated projected cash flows, the estimated value of the collateral
or, if available, the observable market price. Regions generally uses the estimated projected cash flow method to
measure impairment. In determining the appropriate level of allowance for all other loans, including non-accrual
loans less than $2.5 million and TDRs, management uses information to stratify the loan portfolio segments into
loan pools with common risk characteristics. Classes in the commercial and investor real estate portfolio
segments are disaggregated based upon underlying credit quality and probability of default. Classes in the
consumer portfolio segment are disaggregated by product type. Certain portions of the allowance are attributed to
loan pools based on various factors and analyses, including but not limited to, current and historical loss
experience trends and levels of problem credits, current economic conditions, changes in product mix and
underwriting. For consumer TDRs, Regions measures the level of impairment based on pools of loans stratified
by common risk characteristics. All adjustments to the allowance for loan losses are recorded through the
provision for loan losses. See Note 6 for additional information regarding the calculation of the allowance for
loan losses.
In order to estimate a reserve for unfunded commitments, Regions uses a process consistent with that used
in developing the allowance for loan losses. Regions estimates future fundings, which are less than the total
unfunded commitment amounts, based on historical funding experience. Allowance for loan loss factors, which
are based on product and customer type and are consistent with the factors used for portfolio loans, are applied to
these funding estimates to arrive at the reserve balance. Changes in the reserve for unfunded commitments are
recognized in other non-interest expense.
PREMISES AND EQUIPMENT
Premises and equipment are stated at cost, less accumulated depreciation and amortization, as applicable.
Depreciation expense is computed using the straight-line method over the estimated useful lives of the assets.
Leasehold improvements are amortized using the straight-line method over the estimated useful lives of the
improvements (or the terms of the leases, if shorter). Generally, premises and leasehold improvements are
depreciated or amortized over 7-40 years. Furniture and equipment are generally depreciated or amortized over
3-10 years. See Note 8 for detail of premises and equipment.
Regions enters into lease transactions for the right to use assets. These leases vary in term and, from time to
time, include incentives and/or rent escalations. Examples of incentives include periods of “free” rent and
leasehold improvement incentives. Regions recognizes incentives and escalations on a straight-line basis over the
lease term as a reduction of or increase to rent expense, as applicable, in net occupancy expense in the
consolidated statements of operations.
INTANGIBLE ASSETS
Intangible assets include goodwill, which is the excess of cost over the fair value of net assets of acquired
businesses, and other identifiable intangible assets. Other identifiable intangible assets include the following:
1) core deposit intangible assets, which are amounts recorded related to the value of acquired indeterminate-
maturity deposits, 2) amounts capitalized related to the value of acquired customer relationships and 3) amounts
recorded related to employment agreements with certain individuals of acquired entities. Core deposit intangibles
and most other identifiable intangibles are amortized on an accelerated basis over their expected useful lives.
The Company’s goodwill is tested for impairment on an annual basis, or more often if events or
circumstances indicate that there may be impairment. Regions assesses the following indicators of goodwill
impairment for each reporting period:
• Recent operating performance,
134