Regions Bank 2011 Annual Report Download - page 259
Download and view the complete annual report
Please find page 259 of the 2011 Regions Bank annual report below. You can navigate through the pages in the report by either clicking on the pages listed below, or by using the keyword search tool below to find specific information within the annual report.-
 1
1 -
2
-
3
-
4
-
5
-
6
-
7
-
8
-
9
-
10
-
11
-
12
-
13
-
14
-
15
-
16
-
17
-
18
-
19
-
20
-
21
-
22
-
23
-
24
-
25
-
26
-
27
-
28
-
29
-
30
-
31
-
32
-
33
-
34
-
35
-
36
-
37
-
38
-
39
-
40
-
41
-
42
-
43
-
44
-
45
-
46
-
47
-
48
-
49
-
50
-
51
-
52
-
53
-
54
-
55
-
56
-
57
-
58
-
59
-
60
-
61
-
62
-
63
-
64
-
65
-
66
-
67
-
68
-
69
-
70
-
71
-
72
-
73
-
74
-
75
-
76
-
77
-
78
-
79
-
80
-
81
-
82
-
83
-
84
-
85
-
86
-
87
-
88
-
89
-
90
-
91
-
92
-
93
-
94
-
95
-
96
-
97
-
98
-
99
-
100
-
101
-
102
-
103
-
104
-
105
-
106
-
107
-
108
-
109
-
110
-
111
-
112
-
113
-
114
-
115
-
116
-
117
-
118
-
119
-
120
-
121
-
122
-
123
-
124
-
125
-
126
-
127
-
128
-
129
-
130
-
131
-
132
-
133
-
134
-
135
-
136
-
137
-
138
-
139
-
140
-
141
-
142
-
143
-
144
-
145
-
146
-
147
-
148
-
149
-
150
-
151
-
152
-
153
-
154
-
155
-
156
-
157
-
158
-
159
-
160
-
161
-
162
-
163
-
164
-
165
-
166
-
167
-
168
-
169
-
170
-
171
-
172
-
173
-
174
-
175
-
176
-
177
-
178
-
179
-
180
-
181
-
182
-
183
-
184
-
185
-
186
-
187
-
188
-
189
-
190
-
191
-
192
-
193
-
194
-
195
-
196
-
197
-
198
-
199
-
200
-
201
-
202
-
203
-
204
-
205
-
206
-
207
-
208
-
209
-
210
-
211
-
212
-
213
-
214
-
215
-
216
-
217
-
218
-
219
-
220
-
221
-
222
-
223
-
224
-
225
-
226
-
227
-
228
-
229
-
230
-
231
-
232
-
233
-
234
-
235
-
236
-
237
-
238
-
239
-
240
-
241
-
242
-
243
-
244
-
245
-
246
-
247
-
248
-
 249
249 -
 250
250 -
 251
251 -
 252
252 -
 253
253 -
 254
254 -
 255
255 -
 256
256 -
 257
257 -
 258
258 -
 259
259 -
 260
260 -
 261
261 -
 262
262 -
 263
263 -
 264
264 -
 265
265 -
 266
266 -
 267
267 -
 268
268
 |
 |

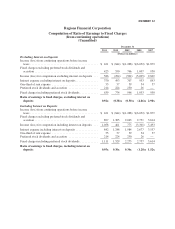
EXHIBIT 12
Regions Financial Corporation
Computation of Ratio of Earnings to Fixed Charges
(from continuing operations)
(Unaudited)
December 31
2011 2010 2009 2008 2007
(Dollars in millions)
Excluding Interest on Deposits
Income (loss) from continuing operations before income
taxes .............................................. $ 161 $ (844) $(1,268) $(6,032) $1,879
Fixed charges excluding preferred stock dividends and
accretion ........................................... 425 550 766 1,007 950
Income (loss) for computation excluding interest on deposits . . . 586 (294) (502) (5,025) 2,829
Interest expense excluding interest on deposits ............... 370 493 707 953 893
One-third of rent expense ............................... 55 57 59 54 57
Preferred stock dividends and accretion .................... 214 224 230 26 —
Fixed charges including preferred stock dividends ............ 639 774 996 1,033 950
Ratio of earnings to fixed charges, excluding interest on
deposits 0.92x (0.38)x (0.50)x (4.86)x 2.98x
Including Interest on Deposits
Income (loss) from continuing operations before income
taxes .............................................. $ 161 $ (844) $(1,268) $(6,032) $1,879
Fixed charges excluding preferred stock dividends and
accretion ........................................... 897 1,305 2,043 2,731 3,614
Income (loss) for computation including interest on deposits . . . 1,058 461 775 (3,301) 5,493
Interest expense including interest on deposits ............... 842 1,248 1,984 2,677 3,557
One-third of rent expense ............................... 55 57 59 54 57
Preferred stock dividends and accretion .................... 214 224 230 26 —
Fixed charges including preferred stock dividends ............ 1,111 1,529 2,273 2,757 3,614
Ratio of earnings to fixed charges, including interest on
deposits 0.95x 0.30x 0.34x (1.20)x 1.52x