Regions Bank 2011 Annual Report Download - page 87
Download and view the complete annual report
Please find page 87 of the 2011 Regions Bank annual report below. You can navigate through the pages in the report by either clicking on the pages listed below, or by using the keyword search tool below to find specific information within the annual report.-
 1
1 -
2
-
3
-
4
-
5
-
6
-
7
-
8
-
9
-
10
-
11
-
12
-
13
-
14
-
15
-
16
-
17
-
18
-
19
-
20
-
21
-
22
-
23
-
24
-
25
-
26
-
27
-
28
-
29
-
30
-
31
-
32
-
33
-
34
-
35
-
36
-
37
-
38
-
39
-
40
-
41
-
42
-
43
-
44
-
45
-
46
-
47
-
48
-
49
-
50
-
51
-
52
-
53
-
54
-
55
-
56
-
57
-
58
-
59
-
60
-
61
-
62
-
63
-
64
-
65
-
66
-
67
-
68
-
69
-
70
-
71
-
72
-
73
-
74
-
75
-
76
-
 77
77 -
 78
78 -
 79
79 -
 80
80 -
 81
81 -
 82
82 -
 83
83 -
 84
84 -
 85
85 -
 86
86 -
 87
87 -
 88
88 -
 89
89 -
 90
90 -
 91
91 -
 92
92 -
 93
93 -
 94
94 -
 95
95 -
 96
96 -
 97
97 -
98
-
99
-
100
-
101
-
102
-
103
-
104
-
105
-
106
-
107
-
108
-
109
-
110
-
111
-
112
-
113
-
114
-
115
-
116
-
117
-
118
-
119
-
120
-
121
-
122
-
123
-
124
-
125
-
126
-
127
-
128
-
129
-
130
-
131
-
132
-
133
-
134
-
135
-
136
-
137
-
138
-
139
-
140
-
141
-
142
-
143
-
144
-
145
-
146
-
147
-
148
-
149
-
150
-
151
-
152
-
153
-
154
-
155
-
156
-
157
-
158
-
159
-
160
-
161
-
162
-
163
-
164
-
165
-
166
-
167
-
168
-
169
-
170
-
171
-
172
-
173
-
174
-
175
-
176
-
177
-
178
-
179
-
180
-
181
-
182
-
183
-
184
-
185
-
186
-
187
-
188
-
189
-
190
-
191
-
192
-
193
-
194
-
195
-
196
-
197
-
198
-
199
-
200
-
201
-
202
-
203
-
204
-
205
-
206
-
207
-
208
-
209
-
210
-
211
-
212
-
213
-
214
-
215
-
216
-
217
-
218
-
219
-
220
-
221
-
222
-
223
-
224
-
225
-
226
-
227
-
228
-
229
-
230
-
231
-
232
-
233
-
234
-
235
-
236
-
237
-
238
-
239
-
240
-
241
-
242
-
243
-
244
-
245
-
246
-
247
-
248
-
249
-
250
-
251
-
252
-
253
-
254
-
255
-
256
-
257
-
258
-
259
-
260
-
261
-
262
-
263
-
264
-
265
-
266
-
267
-
268
 |
 |

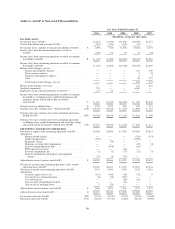
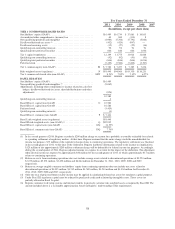
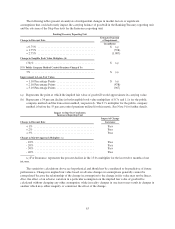
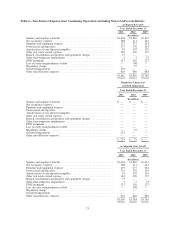
The following tables present an analysis of independent changes in market factors or significant
assumptions that could adversely impact the carrying balance of goodwill in the Banking/Treasury reporting unit
and the outcome of the Step One tests for the Insurance reporting unit:
Banking/Treasury Reporting Unit
Change in Discount Rate
Estimated Amount
of Impairment
(In millions)
+ 0.75% ....................................... $ (a)
+ 1.75% ....................................... (558)
+ 2.75% ....................................... (1,007)
Change in Tangible Book Value Mulipliers (b)
(34)% ......................................... $ (a)
55% Public Company Method Control Premium Changed To
3% ........................................... $ (a)
Improvement in Loan Fair Values
+ 1.10 Percentage Points .......................... $ (a)
+ 2.10 Percentage Points .......................... (478)
+ 3.10 Percentage Points .......................... (967)
(a) Represents the point at which the implied fair value of goodwill would approximate its carrying value.
(b) Represents a 34 percent decline in both tangible book value multipliers of 0.7x and 1.1x for the public
company method and the transaction method, respectively. The 0.7x multiplier for the public company
method is before the 55 percent control premium utilized for this metric. See Note 9 for further details.
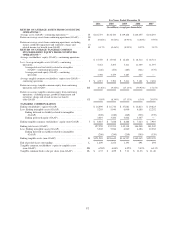
Impact to Step One Conclusion
Insurance Reporting Unit
Impact of Change
Change in Discount Rate Insurance
+1% ......................................... Pass
+2% ......................................... Pass
+3% ......................................... Pass
Change in Market Approach Mulipliers (c)
-10% ........................................ Pass
-20% ........................................ Pass
-30% ........................................ Pass
-40% ........................................ Pass
(c) For Insurance, represents the percent decline in the 13.0x multiplier for the last twelve months of net
income.
The sensitivity calculations above are hypothetical and should not be considered to be predictive of future
performance. Changes in implied fair value based on adverse changes in assumptions generally cannot be
extrapolated because the relationship of the change in assumption to the change in fair value may not be linear.
Also, the effect of an adverse variation in a particular assumption on the implied fair value of goodwill is
calculated without changing any other assumption, while in reality changes in one factor may result in changes in
another which may either magnify or counteract the effect of the change.
63