Regions Bank 2011 Annual Report Download - page 133
Download and view the complete annual report
Please find page 133 of the 2011 Regions Bank annual report below. You can navigate through the pages in the report by either clicking on the pages listed below, or by using the keyword search tool below to find specific information within the annual report.-
 1
1 -
2
-
3
-
4
-
5
-
6
-
7
-
8
-
9
-
10
-
11
-
12
-
13
-
14
-
15
-
16
-
17
-
18
-
19
-
20
-
21
-
22
-
23
-
24
-
25
-
26
-
27
-
28
-
29
-
30
-
31
-
32
-
33
-
34
-
35
-
36
-
37
-
38
-
39
-
40
-
41
-
42
-
43
-
44
-
45
-
46
-
47
-
48
-
49
-
50
-
51
-
52
-
53
-
54
-
55
-
56
-
57
-
58
-
59
-
60
-
61
-
62
-
63
-
64
-
65
-
66
-
67
-
68
-
69
-
70
-
71
-
72
-
73
-
74
-
75
-
76
-
77
-
78
-
79
-
80
-
81
-
82
-
83
-
84
-
85
-
86
-
87
-
88
-
89
-
90
-
91
-
92
-
93
-
94
-
95
-
96
-
97
-
98
-
99
-
100
-
101
-
102
-
103
-
104
-
105
-
106
-
107
-
108
-
109
-
110
-
111
-
112
-
113
-
114
-
115
-
116
-
117
-
118
-
119
-
120
-
121
-
122
-
 123
123 -
 124
124 -
 125
125 -
 126
126 -
 127
127 -
 128
128 -
 129
129 -
 130
130 -
 131
131 -
 132
132 -
 133
133 -
 134
134 -
 135
135 -
 136
136 -
 137
137 -
 138
138 -
 139
139 -
 140
140 -
 141
141 -
 142
142 -
 143
143 -
144
-
145
-
146
-
147
-
148
-
149
-
150
-
151
-
152
-
153
-
154
-
155
-
156
-
157
-
158
-
159
-
160
-
161
-
162
-
163
-
164
-
165
-
166
-
167
-
168
-
169
-
170
-
171
-
172
-
173
-
174
-
175
-
176
-
177
-
178
-
179
-
180
-
181
-
182
-
183
-
184
-
185
-
186
-
187
-
188
-
189
-
190
-
191
-
192
-
193
-
194
-
195
-
196
-
197
-
198
-
199
-
200
-
201
-
202
-
203
-
204
-
205
-
206
-
207
-
208
-
209
-
210
-
211
-
212
-
213
-
214
-
215
-
216
-
217
-
218
-
219
-
220
-
221
-
222
-
223
-
224
-
225
-
226
-
227
-
228
-
229
-
230
-
231
-
232
-
233
-
234
-
235
-
236
-
237
-
238
-
239
-
240
-
241
-
242
-
243
-
244
-
245
-
246
-
247
-
248
-
249
-
250
-
251
-
252
-
253
-
254
-
255
-
256
-
257
-
258
-
259
-
260
-
261
-
262
-
263
-
264
-
265
-
266
-
267
-
268
 |
 |
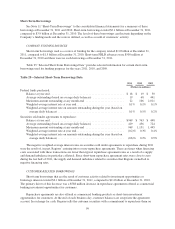
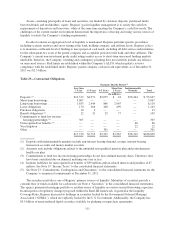
accuracy of its valuation assumptions, counterparty credit risk and changes in interest rates. See Note 20
“Derivative Financial Instruments and Hedging Activities” to the consolidated financial statements for a tabular
summary of Regions’ year-end derivatives positions and further discussion.
On January 1, 2009, Regions began accounting for mortgage servicing rights at fair market value with any
changes to fair value being recorded within mortgage income. Also, in early 2009, Regions entered into
derivative and balance sheet transactions to mitigate the impact of market value fluctuations related to mortgage
servicing rights. Derivative instruments entered in the future could be materially different from the current risk
profile of Regions’ current portfolio.
MARKET RISK—PREPAYMENT RISK
Regions, like most financial institutions, is subject to changing prepayment speeds on mortgage-related
assets under different interest rate environments. Prepayment risk is a significant risk to earnings and specifically
to net interest income. For example, mortgage loans and other financial assets may be prepaid by a debtor, so that
the debtor may refinance its obligations at lower rates. As loans and other financial assets prepay in a falling rate
environment, Regions must reinvest these funds in lower-yielding assets. Prepayments of assets carrying higher
rates reduce Regions’ interest income and overall asset yields. Conversely, in a rising rate environment, these
assets will prepay at a slower rate, resulting in opportunity cost by not having the cash flow to reinvest at higher
rates. Prepayment risk can also impact the value of securities and the carrying value of equity. Regions’ greatest
exposures to prepayment risks primarily rest in its mortgage-backed securities portfolio, the mortgage fixed-rate
loan portfolio and the mortgage servicing asset, all of which tend to be sensitive to interest rate movements.
Regions also has prepayment risk that would be reflected in non-interest income in the form of servicing income
on loans sold. Regions actively monitors prepayment exposure as part of its overall net interest income
forecasting and interest rate risk management. In particular, because interest rates are currently relatively low,
Regions is actively managing exposure to declining prepayments that are expected to coincide with increasing
interest rates in both the loan and securities portfolios.
MARKET RISK—BROKERAGE AND OTHER MARKET ACTIVITY RISK
When there are references to Morgan Keegan it should not be assumed or inferred that any specific activity
mentioned is carried on by any particular Morgan Keegan entity. In addition, in early 2012, Regions entered into
a stock purchase agreement to sell Morgan Keegan to Raymond James Financial, Inc. Refer to Note 3
“Discontinued Operations” and Note 25 “Subsequent Event” to the consolidated financial statements for further
details.
Morgan Keegan’s business activities, including its securities inventory positions and securities held for
investment, expose it to market risk. Further, the Company is also exposed to market risk in its capital markets
business, which includes derivatives, loan syndication and foreign exchange trading activities, and mortgage
trading activity, which includes secondary marketing of loans to government-sponsored entities.
Morgan Keegan trades for its own account in corporate and tax-exempt securities and U.S. Government
agency and Government-sponsored securities. Most of these transactions are entered into to facilitate the
execution of customers’ orders to buy or sell these securities. In addition, it trades certain equity securities in
order to “make a market” in these securities. Morgan Keegan’s trading activities require the commitment of
capital. All principal transactions place the subsidiary’s capital at risk. Profits and losses are dependent upon the
skills of employees and market fluctuations. In order to mitigate the risks of carrying inventory and as part of
other normal brokerage activities, Morgan Keegan assumes short positions on securities.
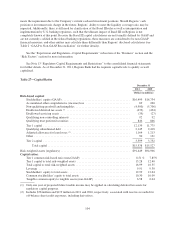
In the normal course of business, Morgan Keegan enters into underwriting and forward and future
commitments. As of December 31, 2011, the total notional amount of forward commitments was approximately
$810 million. Morgan Keegan typically settles its position by entering into equal but opposite contracts and, as
109