Regions Bank 2011 Annual Report Download - page 140
Download and view the complete annual report
Please find page 140 of the 2011 Regions Bank annual report below. You can navigate through the pages in the report by either clicking on the pages listed below, or by using the keyword search tool below to find specific information within the annual report.-
 1
1 -
2
-
3
-
4
-
5
-
6
-
7
-
8
-
9
-
10
-
11
-
12
-
13
-
14
-
15
-
16
-
17
-
18
-
19
-
20
-
21
-
22
-
23
-
24
-
25
-
26
-
27
-
28
-
29
-
30
-
31
-
32
-
33
-
34
-
35
-
36
-
37
-
38
-
39
-
40
-
41
-
42
-
43
-
44
-
45
-
46
-
47
-
48
-
49
-
50
-
51
-
52
-
53
-
54
-
55
-
56
-
57
-
58
-
59
-
60
-
61
-
62
-
63
-
64
-
65
-
66
-
67
-
68
-
69
-
70
-
71
-
72
-
73
-
74
-
75
-
76
-
77
-
78
-
79
-
80
-
81
-
82
-
83
-
84
-
85
-
86
-
87
-
88
-
89
-
90
-
91
-
92
-
93
-
94
-
95
-
96
-
97
-
98
-
99
-
100
-
101
-
102
-
103
-
104
-
105
-
106
-
107
-
108
-
109
-
110
-
111
-
112
-
113
-
114
-
115
-
116
-
117
-
118
-
119
-
120
-
121
-
122
-
123
-
124
-
125
-
126
-
127
-
128
-
129
-
 130
130 -
 131
131 -
 132
132 -
 133
133 -
 134
134 -
 135
135 -
 136
136 -
 137
137 -
 138
138 -
 139
139 -
 140
140 -
 141
141 -
 142
142 -
 143
143 -
 144
144 -
 145
145 -
 146
146 -
 147
147 -
 148
148 -
 149
149 -
 150
150 -
151
-
152
-
153
-
154
-
155
-
156
-
157
-
158
-
159
-
160
-
161
-
162
-
163
-
164
-
165
-
166
-
167
-
168
-
169
-
170
-
171
-
172
-
173
-
174
-
175
-
176
-
177
-
178
-
179
-
180
-
181
-
182
-
183
-
184
-
185
-
186
-
187
-
188
-
189
-
190
-
191
-
192
-
193
-
194
-
195
-
196
-
197
-
198
-
199
-
200
-
201
-
202
-
203
-
204
-
205
-
206
-
207
-
208
-
209
-
210
-
211
-
212
-
213
-
214
-
215
-
216
-
217
-
218
-
219
-
220
-
221
-
222
-
223
-
224
-
225
-
226
-
227
-
228
-
229
-
230
-
231
-
232
-
233
-
234
-
235
-
236
-
237
-
238
-
239
-
240
-
241
-
242
-
243
-
244
-
245
-
246
-
247
-
248
-
249
-
250
-
251
-
252
-
253
-
254
-
255
-
256
-
257
-
258
-
259
-
260
-
261
-
262
-
263
-
264
-
265
-
266
-
267
-
268
 |
 |
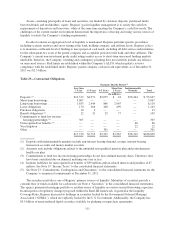
Investor Real Estate—The investor real estate portfolio segment totaled $10.7 billion at year-end 2011 and
includes various loan types. A large component of investor real estate loans is extensions of credit to real estate
developers and investors for the financing of land or buildings, where the repayment is generated from the sale of
the real estate or income generated by the real estate property. Net charge-offs on commercial investor real estate
mortgage loans were 5.52 percent in 2011, as compared to 5.66 percent in 2010. Commercial investor real estate
construction loans are primarily extensions of credit to real estate developers or investors where repayment is
dependent on the sale of real estate or income generated from the real estate collateral. These loans are generally
underwritten and managed by a specialized real estate group that also manages loan disbursements during the
construction process. Net charge-offs on commercial investor real estate construction decreased from 14.32
percent in 2010 to 11.71 percent in 2011.
Residential First Mortgage—The residential first mortgage portfolio primarily contains loans to individuals,
which are secured by single-family residences that are originated through Regions’ branch network. Loans of this
type are generally smaller in size than commercial or investor real estate loans and are geographically dispersed
throughout Regions’ market areas, with some guaranteed by government agencies or private mortgage insurers.
Losses on the residential loan portfolio depend, to a large degree, on the level of interest rates, the unemployment
rate, economic conditions and collateral values. During 2011, losses on single-family residences totaled 1.52
percent, as compared to 1.53 percent in 2010.
Home Equity—The home equity portfolio totaled $13.0 billion at December 31, 2011, as compared to $14.2
billion at December 31, 2010. Substantially all of this portfolio was originated through Regions’ branch network.
Losses in this portfolio generally track overall economic conditions. The main source of economic stress has
been in Florida, where residential property values have declined significantly while unemployment rates rose to
historically high levels. Losses on relationships in Florida where Regions is in a second lien position are higher
than first lien losses. During 2011, losses on home equity decreased to 2.41 percent from 2.80 percent in 2010.
Indirect—Indirect lending, which is lending initiated through third-party business partners, is largely
comprised of loans made through automotive dealerships. Beginning in late 2010, the Company re-entered
indirect auto lending. During 2011, this portfolio class increased $256 million to $1.8 billion. Losses on indirect
loans were 0.75 percent for 2011, as compared to 0.99 percent for 2010.
Consumer Credit Card—During 2011, Regions completed the purchase of approximately 500,000 existing
Regions-branded consumer credit card accounts from FIA Card Services, adding approximately $1.0 billion in
consumer principal balances. The products are primarily open-ended variable interest rate consumer credit card
loans.
Other Consumer —Other consumer loans include direct consumer installment loans, overdrafts and other
revolving credit, and educational loans.
Allowance for Credit Losses
The allowance for credit losses represents management’s estimate of credit losses inherent in the portfolio
as of year-end. The allowance for credit losses consists of two components: the allowance for loan losses and the
reserve for unfunded credit commitments. Management’s assessment of the appropriateness of the allowance for
credit losses is based on a combination of both of these components. Regions determines its allowance for credit
losses in accordance with applicable accounting literature as well as regulatory guidance related to receivables
and contingencies. Binding unfunded credit commitments include items such as letters of credit, financial
guarantees and binding unfunded loan commitments.
Allowance Process—Factors considered by management in determining the adequacy of the allowance
include, but are not limited to: 1) detailed reviews of individual loans; 2) historical and current trends in gross
and net loan charge-offs for the various classes of loans evaluated; 3) the Company’s policies relating to
116