Regions Bank 2011 Annual Report Download - page 226
Download and view the complete annual report
Please find page 226 of the 2011 Regions Bank annual report below. You can navigate through the pages in the report by either clicking on the pages listed below, or by using the keyword search tool below to find specific information within the annual report.-
 1
1 -
2
-
3
-
4
-
5
-
6
-
7
-
8
-
9
-
10
-
11
-
12
-
13
-
14
-
15
-
16
-
17
-
18
-
19
-
20
-
21
-
22
-
23
-
24
-
25
-
26
-
27
-
28
-
29
-
30
-
31
-
32
-
33
-
34
-
35
-
36
-
37
-
38
-
39
-
40
-
41
-
42
-
43
-
44
-
45
-
46
-
47
-
48
-
49
-
50
-
51
-
52
-
53
-
54
-
55
-
56
-
57
-
58
-
59
-
60
-
61
-
62
-
63
-
64
-
65
-
66
-
67
-
68
-
69
-
70
-
71
-
72
-
73
-
74
-
75
-
76
-
77
-
78
-
79
-
80
-
81
-
82
-
83
-
84
-
85
-
86
-
87
-
88
-
89
-
90
-
91
-
92
-
93
-
94
-
95
-
96
-
97
-
98
-
99
-
100
-
101
-
102
-
103
-
104
-
105
-
106
-
107
-
108
-
109
-
110
-
111
-
112
-
113
-
114
-
115
-
116
-
117
-
118
-
119
-
120
-
121
-
122
-
123
-
124
-
125
-
126
-
127
-
128
-
129
-
130
-
131
-
132
-
133
-
134
-
135
-
136
-
137
-
138
-
139
-
140
-
141
-
142
-
143
-
144
-
145
-
146
-
147
-
148
-
149
-
150
-
151
-
152
-
153
-
154
-
155
-
156
-
157
-
158
-
159
-
160
-
161
-
162
-
163
-
164
-
165
-
166
-
167
-
168
-
169
-
170
-
171
-
172
-
173
-
174
-
175
-
176
-
177
-
178
-
179
-
180
-
181
-
182
-
183
-
184
-
185
-
186
-
187
-
188
-
189
-
190
-
191
-
192
-
193
-
194
-
195
-
196
-
197
-
198
-
199
-
200
-
201
-
202
-
203
-
204
-
205
-
206
-
207
-
208
-
209
-
210
-
211
-
212
-
213
-
214
-
215
-
 216
216 -
 217
217 -
 218
218 -
 219
219 -
 220
220 -
 221
221 -
 222
222 -
 223
223 -
 224
224 -
 225
225 -
 226
226 -
 227
227 -
 228
228 -
 229
229 -
 230
230 -
 231
231 -
 232
232 -
 233
233 -
 234
234 -
 235
235 -
 236
236 -
237
-
238
-
239
-
240
-
241
-
242
-
243
-
244
-
245
-
246
-
247
-
248
-
249
-
250
-
251
-
252
-
253
-
254
-
255
-
256
-
257
-
258
-
259
-
260
-
261
-
262
-
263
-
264
-
265
-
266
-
267
-
268
 |
 |

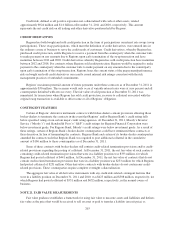
DERIVATIVES NOT DESIGNATED AS HEDGES
The Company maintains a derivatives trading portfolio of interest rate swaps, option contracts, and futures
and forward commitments used to meet the needs of its customers. The portfolio is used to generate trading profit
and to help clients manage market risk. The Company is subject to the credit risk that a counterparty will fail to
perform. The Company is also subject to market risk, which is evaluated by the Company and monitored by the
asset/liability management function. Separate derivative contracts are entered into to reduce overall market
exposure to pre-defined limits. The contracts in this portfolio do not qualify for hedge accounting and are
marked-to-market through earnings and included in other assets and other liabilities.
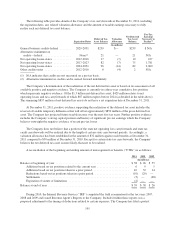
In the normal course of business, Morgan Keegan enters into underwriting and forward and future
commitments on U.S. Government and municipal securities. As of December 31, 2011 and 2010, the total
notional amount related to forward and future commitments was $810 million and $312 million, respectively.
The brokerage subsidiary typically settles its position by entering into equal but opposite contracts and, as such,
the contract amounts do not necessarily represent future cash requirements. Settlement of the transactions
relating to such commitments is not expected to have a material effect on the subsidiary’s financial position.
Transactions involving future settlement give rise to market risk, which represents the potential loss that can be
caused by a change in the market value of a particular financial instrument. The exposure to market risk is
determined by a number of factors, including size, composition and diversification of positions held, the absolute
and relative levels of interest rates, and market volatility.
Regions enters into interest rate lock commitments, which are commitments to originate mortgage loans
whereby the interest rate on the loan is determined prior to funding and the customers have locked into that
interest rate. At December 31, 2011 and 2010, Regions had $559 million and $717 million, respectively, in total
notional amount of rate lock commitments. Regions manages market risk on interest rate lock commitments and
mortgage loans held for sale with corresponding forward sale commitments, which are recorded at fair value with
changes in fair value recorded in mortgage income. At December 31, 2011 and 2010, Regions had $1.3 billion
and $1.7 billion, respectively, in total absolute notional amount related to these forward rate commitments.
FAIR VALUE OPTION
Regions has elected to account for mortgage servicing rights at fair market value with any changes to fair
value being recorded within mortgage income. Concurrent with the election to use the fair value measurement
method, Regions began using various derivative instruments, in the form of forward rate commitments, futures
contracts, swaps and swaptions to mitigate the statement of operations effect of changes in the fair value of its
mortgage servicing rights. As of December 31, 2011 and 2010, the total notional amount related to these
contracts was $5.1 billion and $1.8 billion, respectively.
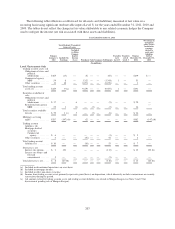
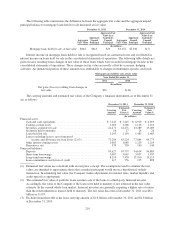
The following tables present the location and amount of gain or (loss) recognized in income on derivatives
not designated as hedging instruments in the statements of operations for the years ended December 31:
Derivatives Not Designated as Hedging Instruments 2011 2010 2009
(In millions)
Capital markets and investment income
Interest rate swaps ................................................................ $ 11 $(10) $ 4
Interest rate options ............................................................... (3) 3 (43)
Interest rate futures and forward commitments ......................................... (1) (3) 7
Other contracts .................................................................. 11 11 2
Total capital markets and investment income ............................................... 18 1 (30)
Mortgage income
Interest rate swaps ................................................................ 80 18 —
Interest rate options ............................................................... 2 (4) (8)
Interest rate futures and forward commitments ......................................... 18 74 50
Total mortgage income ................................................................ 100 88 42
$118 $ 89 $ 12
202