Regions Bank 2011 Annual Report Download - page 119
Download and view the complete annual report
Please find page 119 of the 2011 Regions Bank annual report below. You can navigate through the pages in the report by either clicking on the pages listed below, or by using the keyword search tool below to find specific information within the annual report.-
 1
1 -
2
-
3
-
4
-
5
-
6
-
7
-
8
-
9
-
10
-
11
-
12
-
13
-
14
-
15
-
16
-
17
-
18
-
19
-
20
-
21
-
22
-
23
-
24
-
25
-
26
-
27
-
28
-
29
-
30
-
31
-
32
-
33
-
34
-
35
-
36
-
37
-
38
-
39
-
40
-
41
-
42
-
43
-
44
-
45
-
46
-
47
-
48
-
49
-
50
-
51
-
52
-
53
-
54
-
55
-
56
-
57
-
58
-
59
-
60
-
61
-
62
-
63
-
64
-
65
-
66
-
67
-
68
-
69
-
70
-
71
-
72
-
73
-
74
-
75
-
76
-
77
-
78
-
79
-
80
-
81
-
82
-
83
-
84
-
85
-
86
-
87
-
88
-
89
-
90
-
91
-
92
-
93
-
94
-
95
-
96
-
97
-
98
-
99
-
100
-
101
-
102
-
103
-
104
-
105
-
106
-
107
-
108
-
 109
109 -
 110
110 -
 111
111 -
 112
112 -
 113
113 -
 114
114 -
 115
115 -
 116
116 -
 117
117 -
 118
118 -
 119
119 -
 120
120 -
 121
121 -
 122
122 -
 123
123 -
 124
124 -
 125
125 -
 126
126 -
 127
127 -
 128
128 -
 129
129 -
130
-
131
-
132
-
133
-
134
-
135
-
136
-
137
-
138
-
139
-
140
-
141
-
142
-
143
-
144
-
145
-
146
-
147
-
148
-
149
-
150
-
151
-
152
-
153
-
154
-
155
-
156
-
157
-
158
-
159
-
160
-
161
-
162
-
163
-
164
-
165
-
166
-
167
-
168
-
169
-
170
-
171
-
172
-
173
-
174
-
175
-
176
-
177
-
178
-
179
-
180
-
181
-
182
-
183
-
184
-
185
-
186
-
187
-
188
-
189
-
190
-
191
-
192
-
193
-
194
-
195
-
196
-
197
-
198
-
199
-
200
-
201
-
202
-
203
-
204
-
205
-
206
-
207
-
208
-
209
-
210
-
211
-
212
-
213
-
214
-
215
-
216
-
217
-
218
-
219
-
220
-
221
-
222
-
223
-
224
-
225
-
226
-
227
-
228
-
229
-
230
-
231
-
232
-
233
-
234
-
235
-
236
-
237
-
238
-
239
-
240
-
241
-
242
-
243
-
244
-
245
-
246
-
247
-
248
-
249
-
250
-
251
-
252
-
253
-
254
-
255
-
256
-
257
-
258
-
259
-
260
-
261
-
262
-
263
-
264
-
265
-
266
-
267
-
268
 |
 |

when necessary, and provide current and complete financial information including global cash flows, contingent
liabilities and sources of liquidity. A probability weighting is assigned to the listing of loans due to the inherent
level of uncertainty related to potential actions that a borrower or guarantor may take to prevent the loan from
reaching problem status. Regions assigns the probability weighting based on an assessment of the likelihood that
the necessary actions required to prevent problem loan status will occur. Additionally, for other loans (for
example, smaller dollar loans), a factor based on trends and experience is applied to determine the estimate of
potential future downgrades. Because of the inherent uncertainty in forecasting future events, the estimate of
potential problem loans ultimately represents the estimated aggregate dollar amounts of loans as opposed to an
individual listing of loans.
The majority of the loans on which the potential problem loan estimate is based are classified as substandard
accrual. Detailed disclosures for substandard accrual loans (as well as other credit quality metrics) are included in
Note 6 “Allowance for Credit Losses” to the consolidated financial statements.
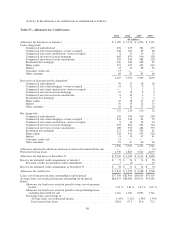
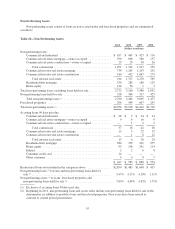
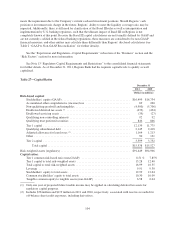
The following table provides an analysis of non-accrual loans (excluding loans held for sale) by portfolio
segment for the year ended December 31, 2011:
Table 21—Analysis of Non-Accrual Loans
Non-Accrual Loans, Excluding Loans Held for Sale
Year Ended December 31, 2011
Commercial
Investor
Real Estate Consumer (1) Total
(In millions)
Balance at beginning of year ............................. $1,102 $1,717 $341 $ 3,160
Additions ........................................ 1,196 1,405 57 2,658
Net payments/other activity ......................... (376) (420) — (796)
Return to accrual .................................. (100) (124) — (224)
Charge-offs on non-accrual loans (2) ................... (531) (776) (4) (1,311)
Transfers to held for sale (3) .......................... (117) (644) (6) (767)
Transfers to foreclosed properties ..................... (89) (145) — (234)
Sales ........................................... (13) (99) (2) (114)
Balance at end of year .................................. $1,072 $ 914 $386 $ 2,372
(1) All net activity within the consumer portfolio segment other than sales and transfers to held for sale is
included as a single net number within the additions line, due to the relative immateriality of consumer
non-accrual loans.
(2) Includes charge-offs on loans on non-accrual status and charge-offs taken upon sale and transfer of
non-accrual loans to held for sale.
(3) Transfers to held for sale are shown net of charge-offs of $513 million recorded upon transfer.
For additional discussion, see Note 6 “Allowance for Credit Losses” to the consolidated financial
statements.
Premises and Equipment
Premises and equipment are stated at cost, less accumulated depreciation and amortization, as applicable.
Premises and equipment at December 31, 2011 decreased $194 million to $2.4 billion compared to year-end
2010. This decrease primarily resulted from depreciation expense.
95