Regions Bank 2011 Annual Report Download - page 117
Download and view the complete annual report
Please find page 117 of the 2011 Regions Bank annual report below. You can navigate through the pages in the report by either clicking on the pages listed below, or by using the keyword search tool below to find specific information within the annual report.-
 1
1 -
2
-
3
-
4
-
5
-
6
-
7
-
8
-
9
-
10
-
11
-
12
-
13
-
14
-
15
-
16
-
17
-
18
-
19
-
20
-
21
-
22
-
23
-
24
-
25
-
26
-
27
-
28
-
29
-
30
-
31
-
32
-
33
-
34
-
35
-
36
-
37
-
38
-
39
-
40
-
41
-
42
-
43
-
44
-
45
-
46
-
47
-
48
-
49
-
50
-
51
-
52
-
53
-
54
-
55
-
56
-
57
-
58
-
59
-
60
-
61
-
62
-
63
-
64
-
65
-
66
-
67
-
68
-
69
-
70
-
71
-
72
-
73
-
74
-
75
-
76
-
77
-
78
-
79
-
80
-
81
-
82
-
83
-
84
-
85
-
86
-
87
-
88
-
89
-
90
-
91
-
92
-
93
-
94
-
95
-
96
-
97
-
98
-
99
-
100
-
101
-
102
-
103
-
104
-
105
-
106
-
 107
107 -
 108
108 -
 109
109 -
 110
110 -
 111
111 -
 112
112 -
 113
113 -
 114
114 -
 115
115 -
 116
116 -
 117
117 -
 118
118 -
 119
119 -
 120
120 -
 121
121 -
 122
122 -
 123
123 -
 124
124 -
 125
125 -
 126
126 -
 127
127 -
128
-
129
-
130
-
131
-
132
-
133
-
134
-
135
-
136
-
137
-
138
-
139
-
140
-
141
-
142
-
143
-
144
-
145
-
146
-
147
-
148
-
149
-
150
-
151
-
152
-
153
-
154
-
155
-
156
-
157
-
158
-
159
-
160
-
161
-
162
-
163
-
164
-
165
-
166
-
167
-
168
-
169
-
170
-
171
-
172
-
173
-
174
-
175
-
176
-
177
-
178
-
179
-
180
-
181
-
182
-
183
-
184
-
185
-
186
-
187
-
188
-
189
-
190
-
191
-
192
-
193
-
194
-
195
-
196
-
197
-
198
-
199
-
200
-
201
-
202
-
203
-
204
-
205
-
206
-
207
-
208
-
209
-
210
-
211
-
212
-
213
-
214
-
215
-
216
-
217
-
218
-
219
-
220
-
221
-
222
-
223
-
224
-
225
-
226
-
227
-
228
-
229
-
230
-
231
-
232
-
233
-
234
-
235
-
236
-
237
-
238
-
239
-
240
-
241
-
242
-
243
-
244
-
245
-
246
-
247
-
248
-
249
-
250
-
251
-
252
-
253
-
254
-
255
-
256
-
257
-
258
-
259
-
260
-
261
-
262
-
263
-
264
-
265
-
266
-
267
-
268
 |
 |

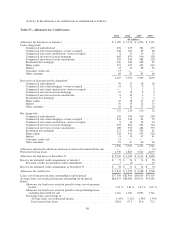
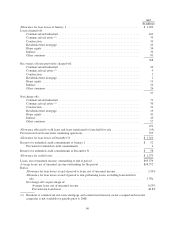
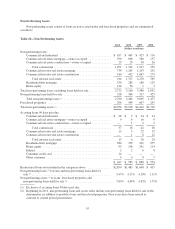
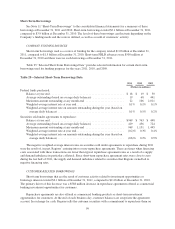
Non-Performing Assets
Non-performing assets consist of loans on non-accrual status and foreclosed properties and are summarized
as follows:
Table 20—Non-Performing Assets
2011 2010 2009 2008
(Dollars in millions)
Non-performing loans:
Commercial and industrial ................................... $ 457 $ 467 $ 427 $ 176
Commercial real estate mortgage—owner-occupied ............... 590 606 560 157
Commercial real estate construction—owner-occupied ............. 25 29 50 26
Total commercial ....................................... 1,072 1,102 1,037 359
Commercial investor real estate mortgage ....................... 734 1,265 1,203 292
Commercial investor real estate construction ..................... 180 452 1,067 273
Total investor real estate ................................. 914 1,717 2,270 565
Residential first mortgage .................................... 250 285 180 125
Home equity .............................................. 136 56 1 3
Total non-performing loans, excluding loans held for sale ............... 2,372 3,160 3,488 1,052
Non-performing loans held for sale ................................ 328 304 317 423
Total non-performing loans (1) ................................. 2,700 3,464 3,805 1,475
Foreclosed properties ........................................... 296 454 607 243
Total non-performing assets (1) .................................... $2,996 $3,918 $4,412 $1,718
Accruing loans 90 days past due:
Commercial and industrial ................................... $ 28 $ 9 $ 24 $ 14
Commercial real estate mortgage—owner-occupied ............... 9 6 16 9
Commercial real estate construction—owner-occupied ............. — 1 2 3
Total commercial ....................................... 37 16 42 26
Commercial investor real estate mortgage ....................... 13 5 22 12
Commercial investor real estate construction ..................... — 1 8 12
Total investor real estate ................................. 13 6 30 24
Residential first mortgage .................................... 284 359 361 275
Home equity .............................................. 93 198 241 214
Indirect ..................................................2268
Consumer credit card ....................................... 14 — — —
Other consumer ............................................4487
$ 447 $ 585 $ 688 $ 554
Restructured loans not included in the categories above ................ $2,850 $1,483 $1,608 $ 455
Non-performing loans (1) to loans and non-performing loans held for
sale (2) ...................................................... 3.47% 4.17% 4.18% 1.51%
Non-performing assets (1) to loans, foreclosed properties and
non-performing loans held for sale (2) ............................. 3.83% 4.69% 4.82% 1.75%
(1) Exclusive of accruing loans 90 days past due.
(2) Beginning in 2011, non-performing loans and assets ratios include non-performing loans held for sale in the
denominator, in addition to portfolio loans and foreclosed properties. Prior years have been revised to
conform to current period presentation.
93