Regions Bank 2011 Annual Report Download - page 11
Download and view the complete annual report
Please find page 11 of the 2011 Regions Bank annual report below. You can navigate through the pages in the report by either clicking on the pages listed below, or by using the keyword search tool below to find specific information within the annual report.-
 1
1 -
 2
2 -
 3
3 -
 4
4 -
 5
5 -
 6
6 -
 7
7 -
 8
8 -
 9
9 -
 10
10 -
 11
11 -
 12
12 -
 13
13 -
 14
14 -
 15
15 -
 16
16 -
 17
17 -
 18
18 -
 19
19 -
 20
20 -
 21
21 -
 22
22 -
23
-
24
-
25
-
26
-
27
-
28
-
29
-
30
-
31
-
32
-
33
-
34
-
35
-
36
-
37
-
38
-
39
-
40
-
41
-
42
-
43
-
44
-
45
-
46
-
47
-
48
-
49
-
50
-
51
-
52
-
53
-
54
-
55
-
56
-
57
-
58
-
59
-
60
-
61
-
62
-
63
-
64
-
65
-
66
-
67
-
68
-
69
-
70
-
71
-
72
-
73
-
74
-
75
-
76
-
77
-
78
-
79
-
80
-
81
-
82
-
83
-
84
-
85
-
86
-
87
-
88
-
89
-
90
-
91
-
92
-
93
-
94
-
95
-
96
-
97
-
98
-
99
-
100
-
101
-
102
-
103
-
104
-
105
-
106
-
107
-
108
-
109
-
110
-
111
-
112
-
113
-
114
-
115
-
116
-
117
-
118
-
119
-
120
-
121
-
122
-
123
-
124
-
125
-
126
-
127
-
128
-
129
-
130
-
131
-
132
-
133
-
134
-
135
-
136
-
137
-
138
-
139
-
140
-
141
-
142
-
143
-
144
-
145
-
146
-
147
-
148
-
149
-
150
-
151
-
152
-
153
-
154
-
155
-
156
-
157
-
158
-
159
-
160
-
161
-
162
-
163
-
164
-
165
-
166
-
167
-
168
-
169
-
170
-
171
-
172
-
173
-
174
-
175
-
176
-
177
-
178
-
179
-
180
-
181
-
182
-
183
-
184
-
185
-
186
-
187
-
188
-
189
-
190
-
191
-
192
-
193
-
194
-
195
-
196
-
197
-
198
-
199
-
200
-
201
-
202
-
203
-
204
-
205
-
206
-
207
-
208
-
209
-
210
-
211
-
212
-
213
-
214
-
215
-
216
-
217
-
218
-
219
-
220
-
221
-
222
-
223
-
224
-
225
-
226
-
227
-
228
-
229
-
230
-
231
-
232
-
233
-
234
-
235
-
236
-
237
-
238
-
239
-
240
-
241
-
242
-
243
-
244
-
245
-
246
-
247
-
248
-
249
-
250
-
251
-
252
-
253
-
254
-
255
-
256
-
257
-
258
-
259
-
260
-
261
-
262
-
263
-
264
-
265
-
266
-
267
-
268
 |
 |

REGIONS 2011 ANNUAL REPORT 9
Platform, a web-based curriculum that teaches,
assesses and certifi es students in hundreds of
fi nancial topics. One of the best examples of
this partnership came during the 2010 – 2011
school year, as our associates helped bring to
life a fi nancial education program for 14 high
school classrooms in Atlanta, Georgia. With
our support, these schools adopted the EverFi
Financial Education Program and more than
1,000 graduates obtained a solid foundation of
personal fi nance and money management skills.
We understand that a lack of knowledge of ba-
sic fi nancial management played a role in the
economic crisis several years ago. With a goal of
supporting fi nancial stabilization throughout the
communities we serve, we all need to be proac-
tive and we take our role seriously in doing our
part to ensure that history doesn’t repeat itself.
Loyalty Drives Performance. Regions’ loyalty
scores are in the top 10%, which is a marked im-
provement to the average score we had in 2008.
We’ve invested time and resources to under-
stand the correlation between loyal customers
and higher loan and deposit balances – and no-
tably, there is a clear correlation. We learned that
loyal customers have on average $1,000 more
in deposit balances versus non-loyal customers.
For loan balances, loyal customers have $1,900
more versus non-loyal customers. Furthermore,
over an 18 month period, loyal customers in-
crease their deposit balances by $2,500 versus
non-loyal; and loyal customers increase their
loan balances by $3,000 versus non-loyal cus-
tomers. We’re not being complacent because of
these results and will continue to fi nd ways to
raise the bar on service excellence.
Relationship managers in our Business Ser-
vices Group are committed to delivering clients
a world-class experience by focusing on three
basic tenets:
• Understanding our clients’ industries, opera-
tions, fi nances, expectations and needs
• Interacting effectively with our clients on a
consistent basis
• Serving as strategic advisors who are valued
by our clients
According to a survey of our business clients,
this focus has resulted in clients who are com-
mitted to keeping their banking relationship with
Regions. On average, the business clients who
report having a committed relationship with us
hold an average of 30% – 50% more in deposits
and loans with us.
The Business Services Group built sustain-
able performance in 2011 by leveraging our
core strength in the small business and middle
market segments. Small business, for example,
experienced interest free deposit growth of 13%
in 2011.
With a goal of supporting fi nancial stabilization throughout
the communities we serve, we all need to be proactive and
we take our role seriously in doing our part to ensure that
history doesn’t repeat itself.
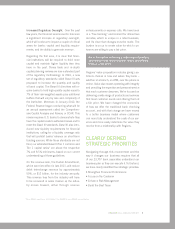
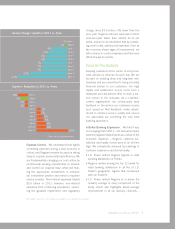
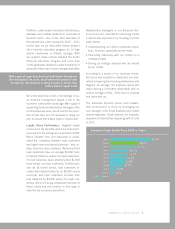
35.0%
24.2%
22.7%
16.1%
15.7%
13.8%
12.8%
11.7%
5.3%
3.6%
Bank 1
Regions
Bank 3
Bank 4
Bank 5
Bank 6
Bank 7
Bank 8
Bank 9
Bank 10
-2.3%
Bank 11
Commercial Loan Growth Since 2009 vs. Peers