Regions Bank 2011 Annual Report Download - page 187
Download and view the complete annual report
Please find page 187 of the 2011 Regions Bank annual report below. You can navigate through the pages in the report by either clicking on the pages listed below, or by using the keyword search tool below to find specific information within the annual report.-
 1
1 -
2
-
3
-
4
-
5
-
6
-
7
-
8
-
9
-
10
-
11
-
12
-
13
-
14
-
15
-
16
-
17
-
18
-
19
-
20
-
21
-
22
-
23
-
24
-
25
-
26
-
27
-
28
-
29
-
30
-
31
-
32
-
33
-
34
-
35
-
36
-
37
-
38
-
39
-
40
-
41
-
42
-
43
-
44
-
45
-
46
-
47
-
48
-
49
-
50
-
51
-
52
-
53
-
54
-
55
-
56
-
57
-
58
-
59
-
60
-
61
-
62
-
63
-
64
-
65
-
66
-
67
-
68
-
69
-
70
-
71
-
72
-
73
-
74
-
75
-
76
-
77
-
78
-
79
-
80
-
81
-
82
-
83
-
84
-
85
-
86
-
87
-
88
-
89
-
90
-
91
-
92
-
93
-
94
-
95
-
96
-
97
-
98
-
99
-
100
-
101
-
102
-
103
-
104
-
105
-
106
-
107
-
108
-
109
-
110
-
111
-
112
-
113
-
114
-
115
-
116
-
117
-
118
-
119
-
120
-
121
-
122
-
123
-
124
-
125
-
126
-
127
-
128
-
129
-
130
-
131
-
132
-
133
-
134
-
135
-
136
-
137
-
138
-
139
-
140
-
141
-
142
-
143
-
144
-
145
-
146
-
147
-
148
-
149
-
150
-
151
-
152
-
153
-
154
-
155
-
156
-
157
-
158
-
159
-
160
-
161
-
162
-
163
-
164
-
165
-
166
-
167
-
168
-
169
-
170
-
171
-
172
-
173
-
174
-
175
-
176
-
 177
177 -
 178
178 -
 179
179 -
 180
180 -
 181
181 -
 182
182 -
 183
183 -
 184
184 -
 185
185 -
 186
186 -
 187
187 -
 188
188 -
 189
189 -
 190
190 -
 191
191 -
 192
192 -
 193
193 -
 194
194 -
 195
195 -
 196
196 -
 197
197 -
198
-
199
-
200
-
201
-
202
-
203
-
204
-
205
-
206
-
207
-
208
-
209
-
210
-
211
-
212
-
213
-
214
-
215
-
216
-
217
-
218
-
219
-
220
-
221
-
222
-
223
-
224
-
225
-
226
-
227
-
228
-
229
-
230
-
231
-
232
-
233
-
234
-
235
-
236
-
237
-
238
-
239
-
240
-
241
-
242
-
243
-
244
-
245
-
246
-
247
-
248
-
249
-
250
-
251
-
252
-
253
-
254
-
255
-
256
-
257
-
258
-
259
-
260
-
261
-
262
-
263
-
264
-
265
-
266
-
267
-
268
 |
 |

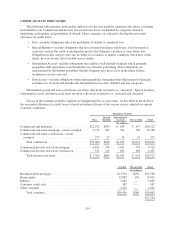
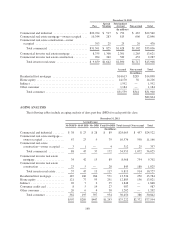
The accruing loans in the table above are considered impaired due to their status as a TDR.
Total Impaired Loans As of December 31, 2011
Year Ended
December 31, 2011
Book Value(3)
Unpaid
Principal
Balance(1)
Charge-offs
and Payments
Applied(2)
Total
Impaired
Loans
Impaired
Loans
with No
Related
Allowance
Impaired
Loans
with
Related
Allowance
Related
Allowance
for Loan
Losses Coverage %(4)
Average
Balance
Interest
Income
Recognized(5)
(Dollars in millions)
Commercial and
industrial ....... $ 758 $ 89 $ 669 $ 61 $ 608 $ 189 36.7% $ 563 $ 7
Commercial real
estate mortgage—
owner occupied . . 884 91 793 34 759 222 35.4 761 5
Commercial real
estate
construction—
owner occupied . . 39 12 27 1 26 10 56.4 30 —
Total
commercial . 1,681 192 1,489 96 1,393 421 36.5 1,354 12
Commercial investor
real estate
mortgage ....... 1,732 143 1,589 63 1,526 397 31.2 1,457 22
Commercial investor
real estate
construction ..... 376 56 320 23 297 143 52.9 449 4
Total investor
real estate . . . 2,108 199 1,909 86 1,823 540 35.1 1,906 26
Residential first
mortgage ....... 1,171 61 1,110 — 1,110 163 19.1 1,086 41
Home equity ...... 454 14 440 — 440 62 16.7 410 21
Indirect ........... 1 — 1 — 1 — — 2 —
Other consumer .... 55 — 55 — 55 1 1.8 61 4
Total
consumer . . . 1,681 75 1,606 — 1,606 226 17.9 1,559 66
Total impaired
loans ........... $5,470 $466 $5,004 $182 $4,822 $1,187 30.2% $4,819 $104
(1) Unpaid principal balance represents the contractual obligation due from the customer and includes the net
book value plus charge-offs and payments applied.
(2) Charge-offs and payments applied represents cumulative partial charge-offs taken, as well as interest
payments received that have been applied against the outstanding principal balance.
(3) Book value represents the unpaid principal balance less charge-offs and payments applied; it is shown
before any allowance for loan losses.
(4) Coverage % represents charge-offs and payments applied plus the related allowance as a percent of the
unpaid principal balance.
(5) Interest income recognized represents interest income on loans modified in a TDR, and are therefore
considered impaired, which are on accruing status.
163