Regions Bank 2011 Annual Report Download - page 218
Download and view the complete annual report
Please find page 218 of the 2011 Regions Bank annual report below. You can navigate through the pages in the report by either clicking on the pages listed below, or by using the keyword search tool below to find specific information within the annual report.-
 1
1 -
2
-
3
-
4
-
5
-
6
-
7
-
8
-
9
-
10
-
11
-
12
-
13
-
14
-
15
-
16
-
17
-
18
-
19
-
20
-
21
-
22
-
23
-
24
-
25
-
26
-
27
-
28
-
29
-
30
-
31
-
32
-
33
-
34
-
35
-
36
-
37
-
38
-
39
-
40
-
41
-
42
-
43
-
44
-
45
-
46
-
47
-
48
-
49
-
50
-
51
-
52
-
53
-
54
-
55
-
56
-
57
-
58
-
59
-
60
-
61
-
62
-
63
-
64
-
65
-
66
-
67
-
68
-
69
-
70
-
71
-
72
-
73
-
74
-
75
-
76
-
77
-
78
-
79
-
80
-
81
-
82
-
83
-
84
-
85
-
86
-
87
-
88
-
89
-
90
-
91
-
92
-
93
-
94
-
95
-
96
-
97
-
98
-
99
-
100
-
101
-
102
-
103
-
104
-
105
-
106
-
107
-
108
-
109
-
110
-
111
-
112
-
113
-
114
-
115
-
116
-
117
-
118
-
119
-
120
-
121
-
122
-
123
-
124
-
125
-
126
-
127
-
128
-
129
-
130
-
131
-
132
-
133
-
134
-
135
-
136
-
137
-
138
-
139
-
140
-
141
-
142
-
143
-
144
-
145
-
146
-
147
-
148
-
149
-
150
-
151
-
152
-
153
-
154
-
155
-
156
-
157
-
158
-
159
-
160
-
161
-
162
-
163
-
164
-
165
-
166
-
167
-
168
-
169
-
170
-
171
-
172
-
173
-
174
-
175
-
176
-
177
-
178
-
179
-
180
-
181
-
182
-
183
-
184
-
185
-
186
-
187
-
188
-
189
-
190
-
191
-
192
-
193
-
194
-
195
-
196
-
197
-
198
-
199
-
200
-
201
-
202
-
203
-
204
-
205
-
206
-
207
-
 208
208 -
 209
209 -
 210
210 -
 211
211 -
 212
212 -
 213
213 -
 214
214 -
 215
215 -
 216
216 -
 217
217 -
 218
218 -
 219
219 -
 220
220 -
 221
221 -
 222
222 -
 223
223 -
 224
224 -
 225
225 -
 226
226 -
 227
227 -
 228
228 -
229
-
230
-
231
-
232
-
233
-
234
-
235
-
236
-
237
-
238
-
239
-
240
-
241
-
242
-
243
-
244
-
245
-
246
-
247
-
248
-
249
-
250
-
251
-
252
-
253
-
254
-
255
-
256
-
257
-
258
-
259
-
260
-
261
-
262
-
263
-
264
-
265
-
266
-
267
-
268
 |
 |

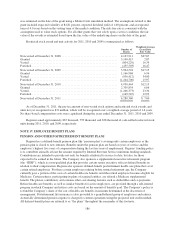
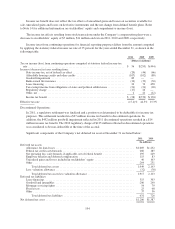
Income tax benefit does not reflect the tax effects of unrealized gains and losses on securities available for
sale, unrealized gains and losses on derivative instruments and the net change from defined benefit plans. Refer
to Note 14 for additional information on stockholders’ equity and comprehensive income (loss).
The income tax effects resulting from stock transactions under the Company’s compensation plans were a
decrease to stockholders’ equity of $7 million, $11 million and zero in 2011, 2010 and 2009, respectively.
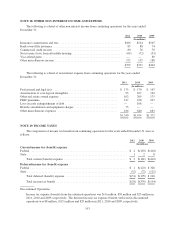
Income taxes from continuing operations for financial reporting purposes differs from the amount computed
by applying the statutory federal income tax rate of 35 percent for the years ended December 31, as shown in the
following table:
2011 2010 2009
(Dollars in millions)
Tax on income (loss) from continuing operations computed at statutory federal income tax
rate ..................................................................... $ 56 $(295) $(444)
Increase (decrease) in taxes resulting from:
State income tax, net of federal tax effect ..................................... (20) (46) (66)
Affordable housing credits and other credits .................................. (107) (102) (80)
Goodwill impairment .................................................... 89 — —
Bank-owned life insurance ................................................ (34) (33) (30)
Lease financing ......................................................... 24 74 458
Tax-exempt income from obligations of states and political subdivisions ............ (21) (21) (20)
Regulatory charge ....................................................... (17) 26 —
Other, net .............................................................. 2 21 (12)
Income tax benefit ....................................................... $ (28) $(376) $(194)
Effective tax rate ............................................................ (17.4)% 44.5% 15.3%
Discontinued Operations:
In 2011, a regulatory settlement was finalized and a portion was determined to be deductible for income tax
purposes. This settlement resulted in a $27 million income tax benefit to discontinued operations. In
addition, the $492 million goodwill impairment reflected in 2011 discontinued operations resulted in a $14
million income tax benefit. The 2010 regulatory charge of $125 million reflected in discontinued operations
was considered to be non-deductible at the time of the accrual.
Significant components of the Company’s net deferred tax asset at December 31 are listed below:
2011 2010
(In millions)
Deferred tax assets:
Allowance for loan losses ........................................................ $1,069 $1,232
Federal tax credit carryforwards ................................................... 260 185
Net operating loss carryfowards, if applicable, net of federal benefit ...................... 195 229
Employee benefits and deferred compensation ....................................... 115 83
Unrealized gains and losses included in stockholders’ equity ............................ 46 163
Other ........................................................................ 264 251
Total deferred tax assets ..................................................... 1,949 2,143
Less: valuation allowance ........................................................ (32) (30)
Total deferred tax assets less valuation allowance ................................. 1,917 2,113
Deferred tax liabilities:
Lease financing ................................................................ 315 303
Goodwill and intangibles ........................................................ 200 240
Mortgage servicing rights ........................................................ 54 79
Fixed assets ................................................................... 25 68
Other ........................................................................ 37 36
Total deferred tax liabilities .................................................. 631 726
Net deferred tax asset ............................................................... $1,286 $1,387
194