Regions Bank 2011 Annual Report Download - page 122
Download and view the complete annual report
Please find page 122 of the 2011 Regions Bank annual report below. You can navigate through the pages in the report by either clicking on the pages listed below, or by using the keyword search tool below to find specific information within the annual report.-
 1
1 -
2
-
3
-
4
-
5
-
6
-
7
-
8
-
9
-
10
-
11
-
12
-
13
-
14
-
15
-
16
-
17
-
18
-
19
-
20
-
21
-
22
-
23
-
24
-
25
-
26
-
27
-
28
-
29
-
30
-
31
-
32
-
33
-
34
-
35
-
36
-
37
-
38
-
39
-
40
-
41
-
42
-
43
-
44
-
45
-
46
-
47
-
48
-
49
-
50
-
51
-
52
-
53
-
54
-
55
-
56
-
57
-
58
-
59
-
60
-
61
-
62
-
63
-
64
-
65
-
66
-
67
-
68
-
69
-
70
-
71
-
72
-
73
-
74
-
75
-
76
-
77
-
78
-
79
-
80
-
81
-
82
-
83
-
84
-
85
-
86
-
87
-
88
-
89
-
90
-
91
-
92
-
93
-
94
-
95
-
96
-
97
-
98
-
99
-
100
-
101
-
102
-
103
-
104
-
105
-
106
-
107
-
108
-
109
-
110
-
111
-
 112
112 -
 113
113 -
 114
114 -
 115
115 -
 116
116 -
 117
117 -
 118
118 -
 119
119 -
 120
120 -
 121
121 -
 122
122 -
 123
123 -
 124
124 -
 125
125 -
 126
126 -
 127
127 -
 128
128 -
 129
129 -
 130
130 -
 131
131 -
 132
132 -
133
-
134
-
135
-
136
-
137
-
138
-
139
-
140
-
141
-
142
-
143
-
144
-
145
-
146
-
147
-
148
-
149
-
150
-
151
-
152
-
153
-
154
-
155
-
156
-
157
-
158
-
159
-
160
-
161
-
162
-
163
-
164
-
165
-
166
-
167
-
168
-
169
-
170
-
171
-
172
-
173
-
174
-
175
-
176
-
177
-
178
-
179
-
180
-
181
-
182
-
183
-
184
-
185
-
186
-
187
-
188
-
189
-
190
-
191
-
192
-
193
-
194
-
195
-
196
-
197
-
198
-
199
-
200
-
201
-
202
-
203
-
204
-
205
-
206
-
207
-
208
-
209
-
210
-
211
-
212
-
213
-
214
-
215
-
216
-
217
-
218
-
219
-
220
-
221
-
222
-
223
-
224
-
225
-
226
-
227
-
228
-
229
-
230
-
231
-
232
-
233
-
234
-
235
-
236
-
237
-
238
-
239
-
240
-
241
-
242
-
243
-
244
-
245
-
246
-
247
-
248
-
249
-
250
-
251
-
252
-
253
-
254
-
255
-
256
-
257
-
258
-
259
-
260
-
261
-
262
-
263
-
264
-
265
-
266
-
267
-
268
 |
 |

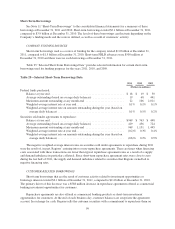
Regions elected to exit the Federal Deposit Insurance Corporation’s (“FDIC”) Transaction Account
Guarantee (“TAG”) program on July 1, 2010. The TAG program was a component of the Temporary Liquidity
Guarantee Program, whereby the FDIC guaranteed all funds held at participating institutions beyond the
$250,000 deposit insurance limit in qualifying transaction accounts. Regions’ decision to exit the program did
not have a significant impact on liquidity. When the Dodd-Frank Act was enacted in July 2010, it permanently
increased the FDIC coverage limit to $250,000. Also as a result of the Dodd-Frank Act, effective as of
December 31, 2010, unlimited coverage for non-interest bearing demand transaction accounts will be provided
until January 1, 2013.
Within customer deposits, non-interest-bearing demand deposits increased $2.5 billion to $28.3 billion,
driven primarily by an increase in non-interest bearing deposits from commercial and small businesses.
Non-interest-bearing deposits accounted for approximately 30 percent of total deposits at year-end 2011 as
compared to 27 percent at year-end 2010. Savings balances increased $491 million to $5.2 billion, generally
reflecting continued savings trends, spurred by economic uncertainty.
Domestic money market products, which exclude foreign money market accounts, are one of Regions’ most
significant funding sources. These balances decreased 16 percent in 2011 to $23 billion or 24 percent of total
deposits, compared to 29 percent of total deposits in 2010. Money market accounts decreased in 2011 due to the
product conversion to interest-bearing transaction deposits.
Included in customer time deposits are certificates of deposit and individual retirement accounts. The
balance of customer time deposits decreased 15 percent in 2011 to $19.4 billion compared to $22.8 billion in
2010. The decrease was primarily due to maturities with minimal reinvestment by customers as a result of a
decline in rates offered on these products. Customer time deposits accounted for 20 percent of total deposits in
2011 compared to 24 percent in 2010.
Consistent with 2010, total treasury deposits, which are used mainly for overnight funding purposes,
remained at low levels in 2011 as the Company continued to utilize customer-based funding and other sources.
The Company’s choice of overnight funding sources is dependent on the Company’s particular funding needs
and the relative attractiveness of each source.
The sensitivity of Regions’ deposit rates to changes in market interest rates is reflected in Regions’ average
interest rate paid on interest-bearing deposits. The rate paid on interest-bearing deposits decreased to 0.69 percent
in 2011 from 1.04 percent in 2010, driven by the expiration of time deposits, the positive mix shift to lower cost
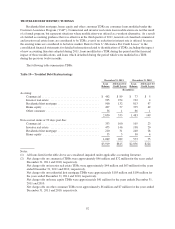
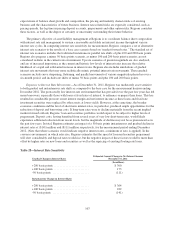
customer products, and continuation of the low interest rate environment throughout 2011. Table 24 “Maturity of
Time Deposits of $100,000 or More” presents maturities of time deposits of $100,000 or more at December 31,
2011 and 2010.
Table 24—Maturity of Time Deposits of $100,000 or More
2011 2010
(In millions)
Time deposits of $100,000 or more, maturing in:
3 months or less ........................................................... $1,216 $1,878
Over 3 through 6 months .................................................... 1,504 1,396
Over 6 through 12 months ................................................... 1,910 1,898
Over 12 months ........................................................... 3,061 3,679
$7,691 $8,851
98