Regions Bank 2011 Annual Report Download - page 210
Download and view the complete annual report
Please find page 210 of the 2011 Regions Bank annual report below. You can navigate through the pages in the report by either clicking on the pages listed below, or by using the keyword search tool below to find specific information within the annual report.-
 1
1 -
2
-
3
-
4
-
5
-
6
-
7
-
8
-
9
-
10
-
11
-
12
-
13
-
14
-
15
-
16
-
17
-
18
-
19
-
20
-
21
-
22
-
23
-
24
-
25
-
26
-
27
-
28
-
29
-
30
-
31
-
32
-
33
-
34
-
35
-
36
-
37
-
38
-
39
-
40
-
41
-
42
-
43
-
44
-
45
-
46
-
47
-
48
-
49
-
50
-
51
-
52
-
53
-
54
-
55
-
56
-
57
-
58
-
59
-
60
-
61
-
62
-
63
-
64
-
65
-
66
-
67
-
68
-
69
-
70
-
71
-
72
-
73
-
74
-
75
-
76
-
77
-
78
-
79
-
80
-
81
-
82
-
83
-
84
-
85
-
86
-
87
-
88
-
89
-
90
-
91
-
92
-
93
-
94
-
95
-
96
-
97
-
98
-
99
-
100
-
101
-
102
-
103
-
104
-
105
-
106
-
107
-
108
-
109
-
110
-
111
-
112
-
113
-
114
-
115
-
116
-
117
-
118
-
119
-
120
-
121
-
122
-
123
-
124
-
125
-
126
-
127
-
128
-
129
-
130
-
131
-
132
-
133
-
134
-
135
-
136
-
137
-
138
-
139
-
140
-
141
-
142
-
143
-
144
-
145
-
146
-
147
-
148
-
149
-
150
-
151
-
152
-
153
-
154
-
155
-
156
-
157
-
158
-
159
-
160
-
161
-
162
-
163
-
164
-
165
-
166
-
167
-
168
-
169
-
170
-
171
-
172
-
173
-
174
-
175
-
176
-
177
-
178
-
179
-
180
-
181
-
182
-
183
-
184
-
185
-
186
-
187
-
188
-
189
-
190
-
191
-
192
-
193
-
194
-
195
-
196
-
197
-
198
-
199
-
 200
200 -
 201
201 -
 202
202 -
 203
203 -
 204
204 -
 205
205 -
 206
206 -
 207
207 -
 208
208 -
 209
209 -
 210
210 -
 211
211 -
 212
212 -
 213
213 -
 214
214 -
 215
215 -
 216
216 -
 217
217 -
 218
218 -
 219
219 -
 220
220 -
221
-
222
-
223
-
224
-
225
-
226
-
227
-
228
-
229
-
230
-
231
-
232
-
233
-
234
-
235
-
236
-
237
-
238
-
239
-
240
-
241
-
242
-
243
-
244
-
245
-
246
-
247
-
248
-
249
-
250
-
251
-
252
-
253
-
254
-
255
-
256
-
257
-
258
-
259
-
260
-
261
-
262
-
263
-
264
-
265
-
266
-
267
-
268
 |
 |

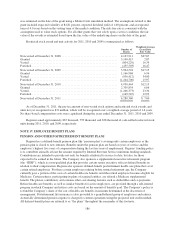
was estimated on the date of the grant using a Monte-Carlo simulation method. The assumptions related to this
grant included expected volatility of 84.81 percent, expected dividend yield of 1.00 percent, and an expected
term of 4.0 years based on the vesting term of the market condition. The risk-free rate is consistent with the
assumption used to value stock options. For all other grants that vest solely upon a service condition, the fair
value of the awards is estimated based upon the fair value of the underlying shares on the date of the grant.
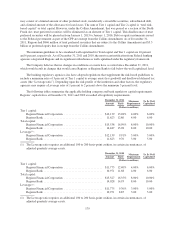
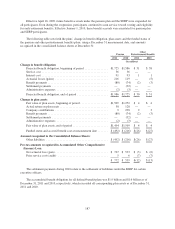
Restricted stock award and unit activity for 2011, 2010 and 2009 is summarized as follows:
Number of
Shares
Weighted-Average
Grant Date
Fair Value
Non-vested at December 31, 2008 ...................................... 4,123,911 $27.67
Granted ........................................................... 3,100,415 2.87
Vested ............................................................ (804,229) 16.39
Forfeited .......................................................... (455,503) 16.47
Non-vested at December 31, 2009 ...................................... 5,964,594 $17.15
Granted ........................................................... 1,166,968 6.96
Vested ............................................................ (936,412) 34.00
Forfeited .......................................................... (1,264,706) 15.97
Non-vested at December 31, 2010 ...................................... 4,930,444 $12.13
Granted ........................................................... 2,705,834 6.66
Vested ............................................................ (1,206,373) 23.36
Forfeited .......................................................... (149,545) 12.93
Non-vested at December 31, 2011 ...................................... 6,280,360 $ 7.60
As of December 31, 2011, the pre-tax amount of non-vested stock options and restricted stock awards and
units not yet recognized was $31 million, which will be recognized over a weighted-average period of 1.4 years.
No share-based compensation costs were capitalized during the years ended December 31, 2011, 2010 and 2009.
Regions issued approximately 867 thousand, 799 thousand, and 638 thousand of cash-settled restricted stock
units during 2011, 2010, and 2009, respectively.
NOTE 17. EMPLOYEE BENEFIT PLANS
PENSION AND OTHER POSTRETIREMENT BENEFIT PLANS
Regions has a defined-benefit pension plan (the “pension plan”) covering only certain employees as the
pension plan is closed to new entrants. Benefits under the pension plan are based on years of service and the
employee’s highest five years of compensation during the last ten years of employment. Regions’ funding policy
is to contribute annually at least the amount required by Internal Revenue Service minimum funding standards.
Contributions are intended to provide not only for benefits attributed to service to date, but also for those
expected to be earned in the future. The Company also sponsors a supplemental executive retirement program
(the “SERP”), which is a non-qualified plan that provides certain senior executive officers defined benefits in
relation to their compensation. Regions also sponsors defined-benefit postretirement health care plans that cover
certain retired employees. For these certain employees retiring before normal retirement age, the Company
currently pays a portion of the costs of certain health care benefits until the retired employee becomes eligible for
Medicare. Certain retirees, participating in plans of acquired entities, are offered a Medicare supplemental
benefit. The plan is contributory and contains other cost-sharing features such as deductibles and co-payments.
Retiree health care benefits, as well as similar benefits for active employees, are provided through a self-insured
program in which Company and retiree costs are based on the amount of benefits paid. The Company’s policy is
to fund the Company’s share of the cost of health care benefits in amounts determined at the discretion of
management. Postretirement life insurance is also provided to a grandfathered group of employees and retirees.
Actuarially determined pension expense is charged to current operations using the projected unit credit method.
All defined-benefit plans are referred to as “the plans” throughout the remainder of this footnote.
186