Regions Bank 2011 Annual Report Download - page 177
Download and view the complete annual report
Please find page 177 of the 2011 Regions Bank annual report below. You can navigate through the pages in the report by either clicking on the pages listed below, or by using the keyword search tool below to find specific information within the annual report.-
 1
1 -
2
-
3
-
4
-
5
-
6
-
7
-
8
-
9
-
10
-
11
-
12
-
13
-
14
-
15
-
16
-
17
-
18
-
19
-
20
-
21
-
22
-
23
-
24
-
25
-
26
-
27
-
28
-
29
-
30
-
31
-
32
-
33
-
34
-
35
-
36
-
37
-
38
-
39
-
40
-
41
-
42
-
43
-
44
-
45
-
46
-
47
-
48
-
49
-
50
-
51
-
52
-
53
-
54
-
55
-
56
-
57
-
58
-
59
-
60
-
61
-
62
-
63
-
64
-
65
-
66
-
67
-
68
-
69
-
70
-
71
-
72
-
73
-
74
-
75
-
76
-
77
-
78
-
79
-
80
-
81
-
82
-
83
-
84
-
85
-
86
-
87
-
88
-
89
-
90
-
91
-
92
-
93
-
94
-
95
-
96
-
97
-
98
-
99
-
100
-
101
-
102
-
103
-
104
-
105
-
106
-
107
-
108
-
109
-
110
-
111
-
112
-
113
-
114
-
115
-
116
-
117
-
118
-
119
-
120
-
121
-
122
-
123
-
124
-
125
-
126
-
127
-
128
-
129
-
130
-
131
-
132
-
133
-
134
-
135
-
136
-
137
-
138
-
139
-
140
-
141
-
142
-
143
-
144
-
145
-
146
-
147
-
148
-
149
-
150
-
151
-
152
-
153
-
154
-
155
-
156
-
157
-
158
-
159
-
160
-
161
-
162
-
163
-
164
-
165
-
166
-
 167
167 -
 168
168 -
 169
169 -
 170
170 -
 171
171 -
 172
172 -
 173
173 -
 174
174 -
 175
175 -
 176
176 -
 177
177 -
 178
178 -
 179
179 -
 180
180 -
 181
181 -
 182
182 -
 183
183 -
 184
184 -
 185
185 -
 186
186 -
 187
187 -
188
-
189
-
190
-
191
-
192
-
193
-
194
-
195
-
196
-
197
-
198
-
199
-
200
-
201
-
202
-
203
-
204
-
205
-
206
-
207
-
208
-
209
-
210
-
211
-
212
-
213
-
214
-
215
-
216
-
217
-
218
-
219
-
220
-
221
-
222
-
223
-
224
-
225
-
226
-
227
-
228
-
229
-
230
-
231
-
232
-
233
-
234
-
235
-
236
-
237
-
238
-
239
-
240
-
241
-
242
-
243
-
244
-
245
-
246
-
247
-
248
-
249
-
250
-
251
-
252
-
253
-
254
-
255
-
256
-
257
-
258
-
259
-
260
-
261
-
262
-
263
-
264
-
265
-
266
-
267
-
268
 |
 |

participant would consider in determining the fair value. Based on the results of the estimated future cash flows,
the Company determines the amount of estimated losses related to credit and the remaining unrealized loss for
which recovery is expected. Significant weighted-average assumptions specific to non-agency residential
mortgage-backed securities for which other-than-temporary impairment was recorded during 2009 include a 22.9
percent collateral default rate projection, 9.2 percent credit subordination support and 14.2 percent delinquency
rate. There was no other-than-temporary impairment related to credit loss where the remaining unrealized loss
recovery was expected during 2011 or 2010.
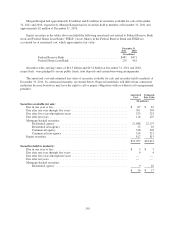
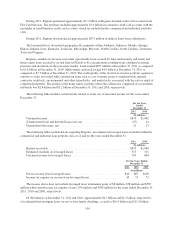
Proceeds from sale, gross gains and gross losses from continuing operations on sales of available for sale
securities are shown in the table below. The cost of securities sold is based on the specific identification method.
For the Years Ended December 31
2011 2010 2009
(In millions)
Proceeds ....................................... $7,859 $10,340 $5,451
Gross securities gains ............................. 112 424 187
Gross securities losses ............................ — (30) (118)
Net securities gains (losses) .................... $ 112 $ 394 $ 69
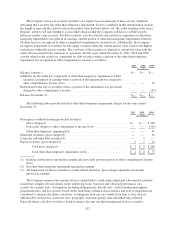
The following table details net gains (losses) for trading account securities for the years ended
December 31:
For the Years Ended December 31
2011 2010 2009
(In millions)
Total net gains .................................... $32 $52 $60
Unrealized portion ................................. (7) 30 27
Morgan Keegan had approximately $35 million, $51 million, and $52 million in total net gains associated
with trading account securities for the years ended December 31, 2011, 2010 and 2009, respectively.
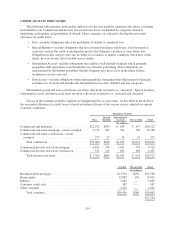
NOTE 5. LOANS
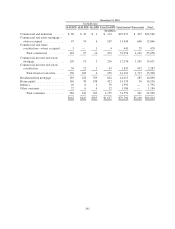
The loan portfolio, net of unearned income, at December 31 consisted of the following:
2011 2010
(In millions, net of unearned income)
Commercial and industrial ........................................... $24,522 $22,540
Commercial real estate mortgage—owner occupied ....................... 11,166 12,046
Commercial real estate construction—owner occupied ..................... 337 470
Total commercial ............................................... 36,025 35,056
Commercial investor real estate mortgage ............................... 9,702 13,621
Commercial investor real estate construction ............................. 1,025 2,287
Total investor real estate ......................................... 10,727 15,908
Residential first mortgage ............................................ 13,784 14,898
Home equity ...................................................... 13,021 14,226
Indirect .......................................................... 1,848 1,592
Consumer credit card ............................................... 987 —
Other consumer .................................................... 1,202 1,184
Total consumer ................................................ 30,842 31,900
$77,594 $82,864
153