Regions Bank 2011 Annual Report Download - page 121
Download and view the complete annual report
Please find page 121 of the 2011 Regions Bank annual report below. You can navigate through the pages in the report by either clicking on the pages listed below, or by using the keyword search tool below to find specific information within the annual report.-
 1
1 -
2
-
3
-
4
-
5
-
6
-
7
-
8
-
9
-
10
-
11
-
12
-
13
-
14
-
15
-
16
-
17
-
18
-
19
-
20
-
21
-
22
-
23
-
24
-
25
-
26
-
27
-
28
-
29
-
30
-
31
-
32
-
33
-
34
-
35
-
36
-
37
-
38
-
39
-
40
-
41
-
42
-
43
-
44
-
45
-
46
-
47
-
48
-
49
-
50
-
51
-
52
-
53
-
54
-
55
-
56
-
57
-
58
-
59
-
60
-
61
-
62
-
63
-
64
-
65
-
66
-
67
-
68
-
69
-
70
-
71
-
72
-
73
-
74
-
75
-
76
-
77
-
78
-
79
-
80
-
81
-
82
-
83
-
84
-
85
-
86
-
87
-
88
-
89
-
90
-
91
-
92
-
93
-
94
-
95
-
96
-
97
-
98
-
99
-
100
-
101
-
102
-
103
-
104
-
105
-
106
-
107
-
108
-
109
-
110
-
 111
111 -
 112
112 -
 113
113 -
 114
114 -
 115
115 -
 116
116 -
 117
117 -
 118
118 -
 119
119 -
 120
120 -
 121
121 -
 122
122 -
 123
123 -
 124
124 -
 125
125 -
 126
126 -
 127
127 -
 128
128 -
 129
129 -
 130
130 -
 131
131 -
132
-
133
-
134
-
135
-
136
-
137
-
138
-
139
-
140
-
141
-
142
-
143
-
144
-
145
-
146
-
147
-
148
-
149
-
150
-
151
-
152
-
153
-
154
-
155
-
156
-
157
-
158
-
159
-
160
-
161
-
162
-
163
-
164
-
165
-
166
-
167
-
168
-
169
-
170
-
171
-
172
-
173
-
174
-
175
-
176
-
177
-
178
-
179
-
180
-
181
-
182
-
183
-
184
-
185
-
186
-
187
-
188
-
189
-
190
-
191
-
192
-
193
-
194
-
195
-
196
-
197
-
198
-
199
-
200
-
201
-
202
-
203
-
204
-
205
-
206
-
207
-
208
-
209
-
210
-
211
-
212
-
213
-
214
-
215
-
216
-
217
-
218
-
219
-
220
-
221
-
222
-
223
-
224
-
225
-
226
-
227
-
228
-
229
-
230
-
231
-
232
-
233
-
234
-
235
-
236
-
237
-
238
-
239
-
240
-
241
-
242
-
243
-
244
-
245
-
246
-
247
-
248
-
249
-
250
-
251
-
252
-
253
-
254
-
255
-
256
-
257
-
258
-
259
-
260
-
261
-
262
-
263
-
264
-
265
-
266
-
267
-
268
 |
 |

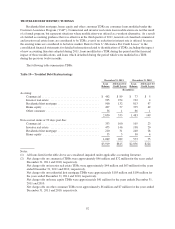
Valuation adjustments are primarily recorded in other non-interest expense; adjustments are also recorded as
a charge to the allowance for loan losses if incurred within 60 days after the date of transfer from loans.
Valuation adjustments are primarily post-foreclosure write-downs that are a result of continued declining
property values based on updated appraisals or other indications of value, such as offers to purchase. Foreclosed
property sold represents the net book value of the properties sold.
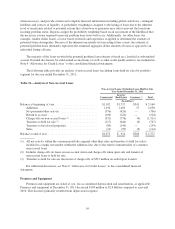
Other Assets
Other assets decreased $675 million to $8.7 billion as of December 31, 2011. Securities sold but not yet
settled near the end of 2010 primarily drove the decrease. Reduced foreclosed properties, deferred tax and
prepaid expense balances also contributed to the year-over-year decrease. The decreases were partially offset by
increased derivative asset balances.
Deposits
Regions competes with other banking and financial services companies for a share of the deposit market.
Regions’ ability to compete in the deposit market depends heavily on the pricing of its deposits and how
effectively the Company meets customers’ needs. Regions employs various means to meet those needs and
enhance competitiveness, such as providing a high level of customer service, competitive pricing and providing
convenient branch locations for its customers. Regions also serves customers through providing centralized,
high-quality banking services and alternative product delivery channels such as internet banking.
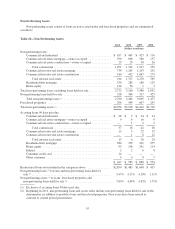
Deposits are Regions’ primary source of funds, providing funding for 85 percent of average interest-earning
assets from continuing operations in 2011 and 82 percent of average interest-earning assets from continuing
operations in 2010. Table 23 “Deposits” details year-over-year deposits on a period-ending basis. Total deposits
as of year-end 2011 increased $1.0 billion, or 1 percent, compared to year-end 2010. The overall increase in
deposits was primarily driven by an increase in non-interest-bearing demand accounts and interest-bearing
transaction accounts. These increases were partially offset by decreases in domestic money market accounts and
time deposits. Regions continues to manage and deepen existing customer relationships, as well as develop new
relationships through client acquisition and new checking products.
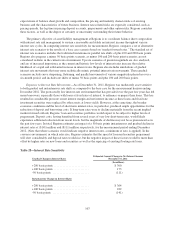
Customer deposits, which exclude deposits used for wholesale funding purposes, increased by 1 percent to
$95.6 billion on an ending basis during 2011. An increase in interest-bearing transaction accounts was the main
source of the increase, combined with an increase in non-interest-bearing demand accounts. A decrease in
domestic money market accounts partially offset these increases. Due to liquidity in the market, Regions has
been able to steadily grow its low-cost customer deposits and reduce its total deposit costs from 1.35 percent in
2009 to 0.78 percent in 2010 and to 0.49 percent in 2011.
Table 23—Deposits
2011 2010 2009
(In millions)
Non-interest-bearing demand ................................................... $28,266 $25,733 $23,204
Savings accounts ............................................................. 5,159 4,668 4,073
Interest-bearing transaction accounts ............................................. 19,388 13,423 15,791
Money market accounts—domestic .............................................. 23,053 27,420 23,291
Money market accounts—foreign ................................................ 378 569 766
Low-cost deposits ........................................................ 76,244 71,813 67,125
Time deposits ............................................................... 19,378 22,784 31,468
Customer deposits ........................................................ 95,622 94,597 98,593
Corporate treasury time deposits ................................................. 5 17 87
$95,627 $94,614 $98,680
97