Regions Bank 2011 Annual Report Download - page 94
Download and view the complete annual report
Please find page 94 of the 2011 Regions Bank annual report below. You can navigate through the pages in the report by either clicking on the pages listed below, or by using the keyword search tool below to find specific information within the annual report.-
 1
1 -
2
-
3
-
4
-
5
-
6
-
7
-
8
-
9
-
10
-
11
-
12
-
13
-
14
-
15
-
16
-
17
-
18
-
19
-
20
-
21
-
22
-
23
-
24
-
25
-
26
-
27
-
28
-
29
-
30
-
31
-
32
-
33
-
34
-
35
-
36
-
37
-
38
-
39
-
40
-
41
-
42
-
43
-
44
-
45
-
46
-
47
-
48
-
49
-
50
-
51
-
52
-
53
-
54
-
55
-
56
-
57
-
58
-
59
-
60
-
61
-
62
-
63
-
64
-
65
-
66
-
67
-
68
-
69
-
70
-
71
-
72
-
73
-
74
-
75
-
76
-
77
-
78
-
79
-
80
-
81
-
82
-
83
-
 84
84 -
 85
85 -
 86
86 -
 87
87 -
 88
88 -
 89
89 -
 90
90 -
 91
91 -
 92
92 -
 93
93 -
 94
94 -
 95
95 -
 96
96 -
 97
97 -
 98
98 -
 99
99 -
 100
100 -
 101
101 -
 102
102 -
 103
103 -
 104
104 -
105
-
106
-
107
-
108
-
109
-
110
-
111
-
112
-
113
-
114
-
115
-
116
-
117
-
118
-
119
-
120
-
121
-
122
-
123
-
124
-
125
-
126
-
127
-
128
-
129
-
130
-
131
-
132
-
133
-
134
-
135
-
136
-
137
-
138
-
139
-
140
-
141
-
142
-
143
-
144
-
145
-
146
-
147
-
148
-
149
-
150
-
151
-
152
-
153
-
154
-
155
-
156
-
157
-
158
-
159
-
160
-
161
-
162
-
163
-
164
-
165
-
166
-
167
-
168
-
169
-
170
-
171
-
172
-
173
-
174
-
175
-
176
-
177
-
178
-
179
-
180
-
181
-
182
-
183
-
184
-
185
-
186
-
187
-
188
-
189
-
190
-
191
-
192
-
193
-
194
-
195
-
196
-
197
-
198
-
199
-
200
-
201
-
202
-
203
-
204
-
205
-
206
-
207
-
208
-
209
-
210
-
211
-
212
-
213
-
214
-
215
-
216
-
217
-
218
-
219
-
220
-
221
-
222
-
223
-
224
-
225
-
226
-
227
-
228
-
229
-
230
-
231
-
232
-
233
-
234
-
235
-
236
-
237
-
238
-
239
-
240
-
241
-
242
-
243
-
244
-
245
-
246
-
247
-
248
-
249
-
250
-
251
-
252
-
253
-
254
-
255
-
256
-
257
-
258
-
259
-
260
-
261
-
262
-
263
-
264
-
265
-
266
-
267
-
268
 |
 |

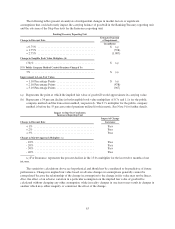
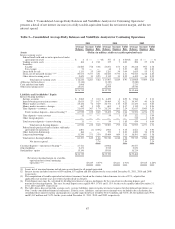
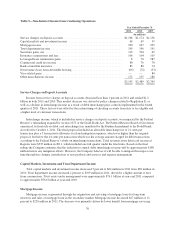
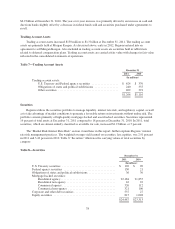
Table 5—Non-Interest Income from Continuing Operations
Year Ended December 31
2011 2010 2009
(In millions)
Service charges on deposit accounts ....................................... $1,168 $1,174 $1,156
Capital markets and investment income .................................... 64 69 39
Mortgage income ...................................................... 220 247 259
Trust department income ................................................ 199 196 191
Securities gains, net .................................................... 112 394 69
Insurance commissions and fees .......................................... 106 104 105
Leveraged lease termination gains ......................................... 8 78 587
Commercial credit fee income ............................................ 80 76 70
Bank-owned life insurance ............................................... 83 88 74
Net revenue (loss) from affordable housing .................................. (69) (72) (53)
Visa-related gains ...................................................... — — 80
Other miscellaneous income ............................................. 172 135 188
$2,143 $2,489 $2,765
Service Charges on Deposit Accounts
Income from service charges on deposit accounts decreased less than 1 percent in 2011 and totaled $1.2
billion in both 2011 and 2010. This modest decrease was driven by policy changes related to Regulation E, as
well as a decline in interchange income as a result of debit interchange price controls implemented in the fourth
quarter of 2011. These factors were offset by the restructuring of checking accounts from free to fee-eligible and
a higher level of customer transactions.
Interchange income, which is included in service charges on deposit accounts, was impacted by the Federal
Reserve’s rulemaking required by section 1075 of the Dodd-Frank Act. The Federal Reserve Board of Governors
announced its final rule on debit card interchange fees mandated by the Durbin Amendment to the Dodd-Frank
Act effective October 1, 2011. The final proposal included an allowable interchange fee of 21 cents per
transaction plus a 5 basis points allowance for fraud mitigation expenses, which was higher than the original
proposal, but below the 44 cents per transaction which was the average amount charged for debit transactions
according to the Federal Reserve’s study on interchange transactions. Total revenues from debit card income at
Regions were $335 million in 2011, which included one full quarter under the final rules. Based on the final
ruling, the Company estimates that the reduction to annual debit interchange revenue will be approximately $180
million before any mitigation efforts. However, the Company believes it will be able to mitigate this impact over
time through fee changes, introduction of new products and services and expense management.
Capital Markets, Investment and Trust Department Income
Total capital markets and investment income decreased 7 percent to $64 million in 2011 from $69 million in
2010. Trust department income increased 2 percent to $199 million in 2011, driven by a higher amount of fees
from commissions. Trust assets under management were approximately $76.1 billion at year-end 2011 compared
to approximately $76.6 billion at year-end 2010.
Mortgage Income
Mortgage income is generated through the origination and servicing of mortgage loans for long-term
investors and sales of mortgage loans in the secondary market. Mortgage income decreased $27 million or 11
percent to $220 million in 2011. The decrease was primarily driven by lower benefit from mortgage servicing
70