Regions Bank 2011 Annual Report Download - page 120
Download and view the complete annual report
Please find page 120 of the 2011 Regions Bank annual report below. You can navigate through the pages in the report by either clicking on the pages listed below, or by using the keyword search tool below to find specific information within the annual report.-
 1
1 -
2
-
3
-
4
-
5
-
6
-
7
-
8
-
9
-
10
-
11
-
12
-
13
-
14
-
15
-
16
-
17
-
18
-
19
-
20
-
21
-
22
-
23
-
24
-
25
-
26
-
27
-
28
-
29
-
30
-
31
-
32
-
33
-
34
-
35
-
36
-
37
-
38
-
39
-
40
-
41
-
42
-
43
-
44
-
45
-
46
-
47
-
48
-
49
-
50
-
51
-
52
-
53
-
54
-
55
-
56
-
57
-
58
-
59
-
60
-
61
-
62
-
63
-
64
-
65
-
66
-
67
-
68
-
69
-
70
-
71
-
72
-
73
-
74
-
75
-
76
-
77
-
78
-
79
-
80
-
81
-
82
-
83
-
84
-
85
-
86
-
87
-
88
-
89
-
90
-
91
-
92
-
93
-
94
-
95
-
96
-
97
-
98
-
99
-
100
-
101
-
102
-
103
-
104
-
105
-
106
-
107
-
108
-
109
-
 110
110 -
 111
111 -
 112
112 -
 113
113 -
 114
114 -
 115
115 -
 116
116 -
 117
117 -
 118
118 -
 119
119 -
 120
120 -
 121
121 -
 122
122 -
 123
123 -
 124
124 -
 125
125 -
 126
126 -
 127
127 -
 128
128 -
 129
129 -
 130
130 -
131
-
132
-
133
-
134
-
135
-
136
-
137
-
138
-
139
-
140
-
141
-
142
-
143
-
144
-
145
-
146
-
147
-
148
-
149
-
150
-
151
-
152
-
153
-
154
-
155
-
156
-
157
-
158
-
159
-
160
-
161
-
162
-
163
-
164
-
165
-
166
-
167
-
168
-
169
-
170
-
171
-
172
-
173
-
174
-
175
-
176
-
177
-
178
-
179
-
180
-
181
-
182
-
183
-
184
-
185
-
186
-
187
-
188
-
189
-
190
-
191
-
192
-
193
-
194
-
195
-
196
-
197
-
198
-
199
-
200
-
201
-
202
-
203
-
204
-
205
-
206
-
207
-
208
-
209
-
210
-
211
-
212
-
213
-
214
-
215
-
216
-
217
-
218
-
219
-
220
-
221
-
222
-
223
-
224
-
225
-
226
-
227
-
228
-
229
-
230
-
231
-
232
-
233
-
234
-
235
-
236
-
237
-
238
-
239
-
240
-
241
-
242
-
243
-
244
-
245
-
246
-
247
-
248
-
249
-
250
-
251
-
252
-
253
-
254
-
255
-
256
-
257
-
258
-
259
-
260
-
261
-
262
-
263
-
264
-
265
-
266
-
267
-
268
 |
 |

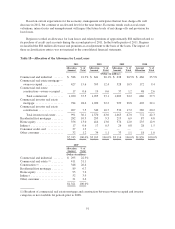
Goodwill
Goodwill totaled $4.8 billion at December 31, 2011 compared to $5.6 billion in 2010. Refer to the “Critical
Accounting Policies” section earlier in this report for detailed discussions of the Company’s methodology for
testing goodwill for impairment and the $745 million impairment charge taken during 2011. Refer to Note 1
“Summary of Significant Accounting Policies” and Note 9 “Intangible Assets” to the consolidated financial
statements, for the methodologies and assumptions used in Step One of the goodwill impairment test.
Additionally, Note 1 “Summary of Significant Accounting Policies” to the consolidated financial statements
includes information related to the fair value measurements of certain assets and liabilities and the valuation
methodology of such pricing, which is also used for testing goodwill for impairment.
Mortgage Servicing Rights
Mortgage servicing rights at December 31, 2011 totaled $182 million compared to $267 million at
December 31, 2010. A summary of mortgage servicing rights is presented in Note 7 “Servicing of Financial
Assets” to the consolidated financial statements. The balances shown represent the right to service mortgage
loans that are owned by other investors. Mortgage servicing rights are presented at fair value as of December 31,
2011 and 2010.
On January 1, 2009, Regions began accounting for mortgage servicing rights at fair market value with any
changes to fair value being recorded within mortgage income. Also, in early 2009, Regions entered into
derivative and trading asset transactions to mitigate the impact of market value fluctuations related to mortgage
servicing rights. However, derivative instruments entered into in the future could be materially different from the
current risk profile of Regions’ current portfolio. See the “Mortgage Income” section earlier in this report for
detail regarding the effect of mortgage servicing rights and related hedging items on Regions’ consolidated
statement of operations.
Other Identifiable Intangible Assets
Other identifiable intangible assets totaled $449 million at December 31, 2011 compared to $385 million at
December 31, 2010. The year-over-year increase was due to the acquisition of Regions’ credit card portfolio that
resulted in recognition of approximately $175 million of purchased credit card intangibles. This increase was
partially offset by amortization of core deposit intangibles. Regions noted no indicators of impairment for any
other identifiable intangible assets during 2011 or 2010. See Note 9 “Intangible Assets” to the consolidated
financial statements for further information.
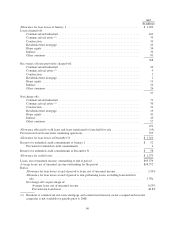
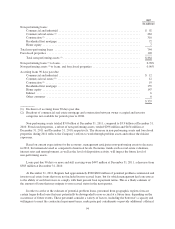
Foreclosed Properties
Other real estate and certain other assets acquired in foreclosure are reported at the lower of the investment
in the loan or fair value of the property less estimated costs to sell. The following table summarizes foreclosed
property activity for the years ended December 31:
Table 22—Foreclosed Properties
2011 2010
(In millions)
Balance at beginning of year ............................................ $454 $607
Transfer from loans ............................................... 532 649
Valuation adjustments ............................................. (161) (225)
Foreclosed property sold ........................................... (518) (565)
Payments and other ................................................ (11) (12)
(158) (153)
Balance at end of year ................................................. $296 $454
Note: Approximately 73 percent and 72 percent of the ending balances as of December 31, 2011 and 2010,
respectively, relates to properties transferred in to foreclosed properties during the corresponding calendar year.
96