Regions Bank 2011 Annual Report Download - page 8
Download and view the complete annual report
Please find page 8 of the 2011 Regions Bank annual report below. You can navigate through the pages in the report by either clicking on the pages listed below, or by using the keyword search tool below to find specific information within the annual report.-
 1
1 -
 2
2 -
 3
3 -
 4
4 -
 5
5 -
 6
6 -
 7
7 -
 8
8 -
 9
9 -
 10
10 -
 11
11 -
 12
12 -
 13
13 -
 14
14 -
 15
15 -
 16
16 -
 17
17 -
 18
18 -
 19
19 -
20
-
21
-
22
-
23
-
24
-
25
-
26
-
27
-
28
-
29
-
30
-
31
-
32
-
33
-
34
-
35
-
36
-
37
-
38
-
39
-
40
-
41
-
42
-
43
-
44
-
45
-
46
-
47
-
48
-
49
-
50
-
51
-
52
-
53
-
54
-
55
-
56
-
57
-
58
-
59
-
60
-
61
-
62
-
63
-
64
-
65
-
66
-
67
-
68
-
69
-
70
-
71
-
72
-
73
-
74
-
75
-
76
-
77
-
78
-
79
-
80
-
81
-
82
-
83
-
84
-
85
-
86
-
87
-
88
-
89
-
90
-
91
-
92
-
93
-
94
-
95
-
96
-
97
-
98
-
99
-
100
-
101
-
102
-
103
-
104
-
105
-
106
-
107
-
108
-
109
-
110
-
111
-
112
-
113
-
114
-
115
-
116
-
117
-
118
-
119
-
120
-
121
-
122
-
123
-
124
-
125
-
126
-
127
-
128
-
129
-
130
-
131
-
132
-
133
-
134
-
135
-
136
-
137
-
138
-
139
-
140
-
141
-
142
-
143
-
144
-
145
-
146
-
147
-
148
-
149
-
150
-
151
-
152
-
153
-
154
-
155
-
156
-
157
-
158
-
159
-
160
-
161
-
162
-
163
-
164
-
165
-
166
-
167
-
168
-
169
-
170
-
171
-
172
-
173
-
174
-
175
-
176
-
177
-
178
-
179
-
180
-
181
-
182
-
183
-
184
-
185
-
186
-
187
-
188
-
189
-
190
-
191
-
192
-
193
-
194
-
195
-
196
-
197
-
198
-
199
-
200
-
201
-
202
-
203
-
204
-
205
-
206
-
207
-
208
-
209
-
210
-
211
-
212
-
213
-
214
-
215
-
216
-
217
-
218
-
219
-
220
-
221
-
222
-
223
-
224
-
225
-
226
-
227
-
228
-
229
-
230
-
231
-
232
-
233
-
234
-
235
-
236
-
237
-
238
-
239
-
240
-
241
-
242
-
243
-
244
-
245
-
246
-
247
-
248
-
249
-
250
-
251
-
252
-
253
-
254
-
255
-
256
-
257
-
258
-
259
-
260
-
261
-
262
-
263
-
264
-
265
-
266
-
267
-
268
 |
 |

REGIONS 2011 ANNUAL REPORT6
Importantly, this transaction reduces our over-
all risk profi le, enhances liquidity and improves
Regions’ capital ratios while reducing our ex-
pense base and enhancing our focus on our core
banking business. Because we retained our asset
management and trust businesses, we remain
well positioned to continue serving the wealth
management needs of our customers. This trans-
action establishes an on-going relationship with
Raymond James, further enhancing our ability
to serve our existing customers. We also ex-
pect that we will maintain important business
relationships with Morgan Keegan associates
that were developed over many years of working
together to serve our customers’ needs.
This transaction, along with achieving continued,
sustainable profi tability and demonstrating a
material improvement in our credit quality, are
all key steps toward the eventual repayment of
the government’s investment in Regions. We
believe we have made tremendous progress in
these regards, but we remain prudent and want
to pay back the government’s investment from a
place of strength and in as shareholder-friendly
manner as possible.
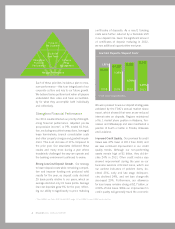
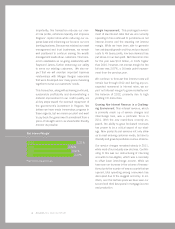
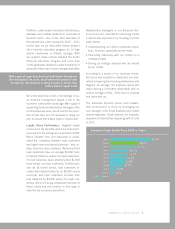
Margin Improvement. This prolonged environ-
ment of low interest rates that we are currently
operating in has continued to put strains on net
interest income and the resulting net interest
margin. While we have been able to generate
low cost deposit growth and thus reduce deposit
costs to 49 basis points, low loan demand has
put stress on our loan yield. Net interest income
for the year was $3.4 billion, or 0.6% higher
than 2010. However, net interest margin for the
full year was 3.07%, a 16 basis point improve-
ment from the previous year.
We continue to forecast that interest rates will
remain low through 2012 and barring any un-
expected movement in interest rates, we ex-
pect net interest margin to grow modestly over
the balance of 2012, primarily due to high
yielding CD maturities.
Growing Non-Interest Revenue in a Challeng-
ing Environment. Non-interest revenue, which
is primarily made up of service charges and
interchange fees, was a particular focus in
2011. With the new restrictions recently im-
posed, the ability to grow fee-based revenues
has proven to be a critical aspect of our strat-
egy. New products and services not only allow
us to meet evolving customer needs, but also to
diversify and grow dependable revenue streams.
Our service charges remained steady in 2011,
while most of our industry saw declines. Contrib-
uting to this was our restructuring of checking
accounts to fee-eligible, which was a necessity
to offset lower interchange income. While we
have seen an increase in the volume of transac-
tions due to the number of new accounts that we
opened, total spending among consumers has
decreased due to the sluggish economy. In ad-
dition, over the last two years we have seen our
second and third best years in mortgage income
and production.
2008
2009
2010
2011
3.23 %
2.68%
2.91%
3.07%
Net Interest Margin*
*From continuing operations