Regions Bank 2011 Annual Report Download - page 150
Download and view the complete annual report
Please find page 150 of the 2011 Regions Bank annual report below. You can navigate through the pages in the report by either clicking on the pages listed below, or by using the keyword search tool below to find specific information within the annual report.-
 1
1 -
2
-
3
-
4
-
5
-
6
-
7
-
8
-
9
-
10
-
11
-
12
-
13
-
14
-
15
-
16
-
17
-
18
-
19
-
20
-
21
-
22
-
23
-
24
-
25
-
26
-
27
-
28
-
29
-
30
-
31
-
32
-
33
-
34
-
35
-
36
-
37
-
38
-
39
-
40
-
41
-
42
-
43
-
44
-
45
-
46
-
47
-
48
-
49
-
50
-
51
-
52
-
53
-
54
-
55
-
56
-
57
-
58
-
59
-
60
-
61
-
62
-
63
-
64
-
65
-
66
-
67
-
68
-
69
-
70
-
71
-
72
-
73
-
74
-
75
-
76
-
77
-
78
-
79
-
80
-
81
-
82
-
83
-
84
-
85
-
86
-
87
-
88
-
89
-
90
-
91
-
92
-
93
-
94
-
95
-
96
-
97
-
98
-
99
-
100
-
101
-
102
-
103
-
104
-
105
-
106
-
107
-
108
-
109
-
110
-
111
-
112
-
113
-
114
-
115
-
116
-
117
-
118
-
119
-
120
-
121
-
122
-
123
-
124
-
125
-
126
-
127
-
128
-
129
-
130
-
131
-
132
-
133
-
134
-
135
-
136
-
137
-
138
-
139
-
 140
140 -
 141
141 -
 142
142 -
 143
143 -
 144
144 -
 145
145 -
 146
146 -
 147
147 -
 148
148 -
 149
149 -
 150
150 -
 151
151 -
 152
152 -
 153
153 -
 154
154 -
 155
155 -
 156
156 -
 157
157 -
 158
158 -
 159
159 -
 160
160 -
161
-
162
-
163
-
164
-
165
-
166
-
167
-
168
-
169
-
170
-
171
-
172
-
173
-
174
-
175
-
176
-
177
-
178
-
179
-
180
-
181
-
182
-
183
-
184
-
185
-
186
-
187
-
188
-
189
-
190
-
191
-
192
-
193
-
194
-
195
-
196
-
197
-
198
-
199
-
200
-
201
-
202
-
203
-
204
-
205
-
206
-
207
-
208
-
209
-
210
-
211
-
212
-
213
-
214
-
215
-
216
-
217
-
218
-
219
-
220
-
221
-
222
-
223
-
224
-
225
-
226
-
227
-
228
-
229
-
230
-
231
-
232
-
233
-
234
-
235
-
236
-
237
-
238
-
239
-
240
-
241
-
242
-
243
-
244
-
245
-
246
-
247
-
248
-
249
-
250
-
251
-
252
-
253
-
254
-
255
-
256
-
257
-
258
-
259
-
260
-
261
-
262
-
263
-
264
-
265
-
266
-
267
-
268
 |
 |

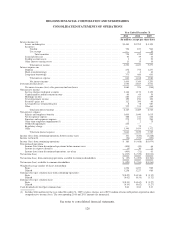
REGIONS FINANCIAL CORPORATION AND SUBSIDIARIES
CONSOLIDATED STATEMENTS OF OPERATIONS
Year Ended December 31
2011 2010 2009
(In millions, except per share data)
Interest income on:
Loans, including fees .............................................................. $3,444 $3,705 $ 4,199
Securities:
Taxable ..................................................................... 758 873 966
Tax-exempt .................................................................. — 1 19
Total securities ........................................................... 758 874 985
Loans held for sale ................................................................ 36 39 55
Trading account assets ............................................................. 1 4 22
Other interest-earning assets ......................................................... 13 15 16
Total interest income ........................................................... 4,252 4,637 5,277
Interest expense on:
Deposits......................................................................... 472 755 1,277
Short-term borrowings ............................................................. (1) 4 44
Long-term borrowings ............................................................. 371 489 663
Total interest expense .......................................................... 842 1,248 1,984
Net interest income ............................................................ 3,410 3,389 3,293
Provision for loan losses ................................................................ 1,530 2,863 3,541
Net interest income (loss) after provision for loan losses ................................... 1,880 526 (248)
Non-interest income:
Service charges on deposit accounts ................................................... 1,168 1,174 1,156
Capital markets and investment income ................................................ 64 69 39
Mortgage income ................................................................. 220 247 259
Trust department income ........................................................... 199 196 191
Securities gains, net ............................................................... 112 394 69
Leveraged lease termination gains .................................................... 8 78 587
Other ........................................................................... 372 331 464
Total non-interest income ....................................................... 2,143 2,489 2,765
Non-interest expense:
Salaries and employee benefits ....................................................... 1,604 1,640 1,635
Net occupancy expense ............................................................. 388 411 422
Furniture and equipment expense ..................................................... 275 277 281
Other-than-temporary impairments(1) ................................................. 2 2 75
Goodwill impairment .............................................................. 253 — —
Regulatory charge ................................................................. — 75 —
Other ........................................................................... 1,340 1,454 1,372
Total non-interest expense ...................................................... 3,862 3,859 3,785
Income (loss) from continuing operations before income taxes .................................. 161 (844) (1,268)
Income tax benefit ..................................................................... (28) (376) (194)
Income (loss) from continuing operations .................................................. $ 189 $ (468) $(1,074)
Discontinued operations:
Income (loss) from discontinued operations before income taxes ............................ (408) (41) 66
Income tax expense (benefit) ........................................................ (4) 30 23
Income (loss) from discontinued operations, net of tax .................................... (404) (71) 43
Net income (loss) ..................................................................... $ (215) $ (539) $(1,031)
Net income (loss) from continuing operations available to common shareholders ................... $ (25) $ (692) $(1,304)
Net income (loss) available to common shareholders ......................................... $ (429) $ (763) $(1,261)
Weighted-average number of shares outstanding:
Basic ........................................................................... 1,258 1,227 989
Diluted.......................................................................... 1,258 1,227 989
Earnings (loss) per common share from continuing operations:
Basic ........................................................................... $(0.02) $ (0.56) $ (1.32)
Diluted.......................................................................... (0.02) (0.56) (1.32)
Earnings (loss) per common share:
Basic ........................................................................... $(0.34) $ (0.62) $ (1.27)
Diluted.......................................................................... (0.34) (0.62) (1.27)
Cash dividends declared per common share ................................................. 0.04 0.04 0.13
(1) Includes $266 million for the year ended December 31, 2009, of gross charges, net of $191 million of non-credit portion reported in other
comprehensive income (loss). The corresponding 2010 and 2011 amounts are immaterial.
See notes to consolidated financial statements.
126