Regions Bank 2011 Annual Report Download - page 205
Download and view the complete annual report
Please find page 205 of the 2011 Regions Bank annual report below. You can navigate through the pages in the report by either clicking on the pages listed below, or by using the keyword search tool below to find specific information within the annual report.-
 1
1 -
2
-
3
-
4
-
5
-
6
-
7
-
8
-
9
-
10
-
11
-
12
-
13
-
14
-
15
-
16
-
17
-
18
-
19
-
20
-
21
-
22
-
23
-
24
-
25
-
26
-
27
-
28
-
29
-
30
-
31
-
32
-
33
-
34
-
35
-
36
-
37
-
38
-
39
-
40
-
41
-
42
-
43
-
44
-
45
-
46
-
47
-
48
-
49
-
50
-
51
-
52
-
53
-
54
-
55
-
56
-
57
-
58
-
59
-
60
-
61
-
62
-
63
-
64
-
65
-
66
-
67
-
68
-
69
-
70
-
71
-
72
-
73
-
74
-
75
-
76
-
77
-
78
-
79
-
80
-
81
-
82
-
83
-
84
-
85
-
86
-
87
-
88
-
89
-
90
-
91
-
92
-
93
-
94
-
95
-
96
-
97
-
98
-
99
-
100
-
101
-
102
-
103
-
104
-
105
-
106
-
107
-
108
-
109
-
110
-
111
-
112
-
113
-
114
-
115
-
116
-
117
-
118
-
119
-
120
-
121
-
122
-
123
-
124
-
125
-
126
-
127
-
128
-
129
-
130
-
131
-
132
-
133
-
134
-
135
-
136
-
137
-
138
-
139
-
140
-
141
-
142
-
143
-
144
-
145
-
146
-
147
-
148
-
149
-
150
-
151
-
152
-
153
-
154
-
155
-
156
-
157
-
158
-
159
-
160
-
161
-
162
-
163
-
164
-
165
-
166
-
167
-
168
-
169
-
170
-
171
-
172
-
173
-
174
-
175
-
176
-
177
-
178
-
179
-
180
-
181
-
182
-
183
-
184
-
185
-
186
-
187
-
188
-
189
-
190
-
191
-
192
-
193
-
194
-
 195
195 -
 196
196 -
 197
197 -
 198
198 -
 199
199 -
 200
200 -
 201
201 -
 202
202 -
 203
203 -
 204
204 -
 205
205 -
 206
206 -
 207
207 -
 208
208 -
 209
209 -
 210
210 -
 211
211 -
 212
212 -
 213
213 -
 214
214 -
 215
215 -
216
-
217
-
218
-
219
-
220
-
221
-
222
-
223
-
224
-
225
-
226
-
227
-
228
-
229
-
230
-
231
-
232
-
233
-
234
-
235
-
236
-
237
-
238
-
239
-
240
-
241
-
242
-
243
-
244
-
245
-
246
-
247
-
248
-
249
-
250
-
251
-
252
-
253
-
254
-
255
-
256
-
257
-
258
-
259
-
260
-
261
-
262
-
263
-
264
-
265
-
266
-
267
-
268
 |
 |

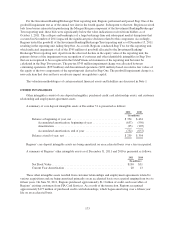
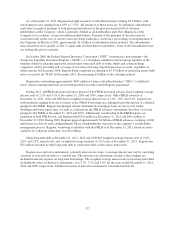
On May 20, 2009, the Company announced a public equity offering and issued 460 million shares of
common stock at $4 per share, generating proceeds of $1.8 billion, net of issuance costs.
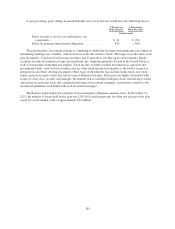
In addition to the offerings mentioned above, the Company also exchanged approximately 33 million
common shares for $202 million of outstanding 6.625 percent trust preferred securities issued by Regions
Financing Trust II (“the Trust”) in the second quarter of 2009. The trust preferred securities were exchanged for
junior subordinated notes issued by the Company to the Trust. The Company recognized a pre-tax gain of
approximately $61 million on the extinguishment of the junior subordinated notes. The increase in shareholders’
equity related to the debt for common share exchange was approximately $135 million, net of issuance costs.
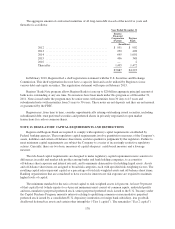
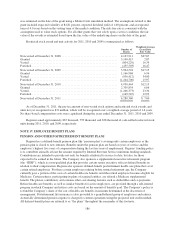
At December 31, 2011, there were approximately 46,530,000 shares reserved for issuance under stock
compensation plans. Stock options outstanding represent approximately 46,351,000 shares and approximately
179,000 shares are reserved for issuance under deferred compensation plans.
The Board of Directors declared a $0.04 annual cash dividend for 2011 and 2010, compared to $0.13 in
2009. Regions does not expect to increase its quarterly dividend above the current $0.01 per common share for
the foreseeable future.
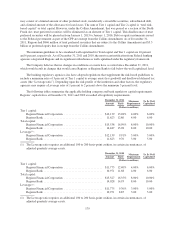
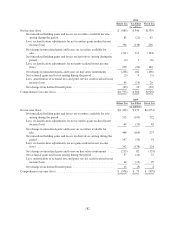
Comprehensive income (loss) is the total of net income (loss) and all other non-owner changes in equity.
Items that are to be recognized under accounting standards as components of comprehensive income (loss) are
displayed in the consolidated statements of changes in stockholders’ equity. In the calculation of comprehensive
income (loss), certain reclassification adjustments are made to avoid double-counting items that are displayed as
part of net income (loss) for a period that also had been displayed as part of other comprehensive income (loss) in
that period or earlier periods. The reconciliations of net income (loss) to comprehensive income (loss) are
presented on a consolidated basis, including income (loss) from continuing operations and income (loss) from
discontinued operations for all periods presented. There are no comprehensive income (loss) items within
discontinued operations, other than net income (loss).
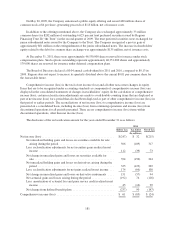
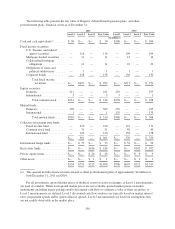
The disclosure of the reclassification amount for the years ended December 31 is as follows:
2011
Before Tax Tax Effect Net of Tax
(In millions)
Net income (loss) ................................................. $(247) $ 32 $(215)
Net unrealized holding gains and losses on securities available for sale
arising during the period ..................................... 506 (189) 317
Less: reclassification adjustments for net securities gains realized in net
income ................................................... 112 (39) 73
Net change in unrealized gains and losses on securities available for
sale ...................................................... 394 (150) 244
Net unrealized holding gains and losses on derivatives arising during the
period .................................................... 325 (123) 202
Less: reclassification adjustments for net gains realized in net income . . . 174 (66) 108
Net change in unrealized gains and losses on derivative instruments .... 151 (57) 94
Net actuarial gains and losses arising during the period ............... (192) 74 (118)
Less: amortization of actuarial loss and prior service credit realized in net
income ................................................... 45 (16) 29
Net change from defined benefit plans ............................ (237) 90 (147)
Comprehensive income (loss) ....................................... $ 61 $ (85) $ (24)
181