Regions Bank 2011 Annual Report Download - page 211
Download and view the complete annual report
Please find page 211 of the 2011 Regions Bank annual report below. You can navigate through the pages in the report by either clicking on the pages listed below, or by using the keyword search tool below to find specific information within the annual report.-
 1
1 -
2
-
3
-
4
-
5
-
6
-
7
-
8
-
9
-
10
-
11
-
12
-
13
-
14
-
15
-
16
-
17
-
18
-
19
-
20
-
21
-
22
-
23
-
24
-
25
-
26
-
27
-
28
-
29
-
30
-
31
-
32
-
33
-
34
-
35
-
36
-
37
-
38
-
39
-
40
-
41
-
42
-
43
-
44
-
45
-
46
-
47
-
48
-
49
-
50
-
51
-
52
-
53
-
54
-
55
-
56
-
57
-
58
-
59
-
60
-
61
-
62
-
63
-
64
-
65
-
66
-
67
-
68
-
69
-
70
-
71
-
72
-
73
-
74
-
75
-
76
-
77
-
78
-
79
-
80
-
81
-
82
-
83
-
84
-
85
-
86
-
87
-
88
-
89
-
90
-
91
-
92
-
93
-
94
-
95
-
96
-
97
-
98
-
99
-
100
-
101
-
102
-
103
-
104
-
105
-
106
-
107
-
108
-
109
-
110
-
111
-
112
-
113
-
114
-
115
-
116
-
117
-
118
-
119
-
120
-
121
-
122
-
123
-
124
-
125
-
126
-
127
-
128
-
129
-
130
-
131
-
132
-
133
-
134
-
135
-
136
-
137
-
138
-
139
-
140
-
141
-
142
-
143
-
144
-
145
-
146
-
147
-
148
-
149
-
150
-
151
-
152
-
153
-
154
-
155
-
156
-
157
-
158
-
159
-
160
-
161
-
162
-
163
-
164
-
165
-
166
-
167
-
168
-
169
-
170
-
171
-
172
-
173
-
174
-
175
-
176
-
177
-
178
-
179
-
180
-
181
-
182
-
183
-
184
-
185
-
186
-
187
-
188
-
189
-
190
-
191
-
192
-
193
-
194
-
195
-
196
-
197
-
198
-
199
-
200
-
 201
201 -
 202
202 -
 203
203 -
 204
204 -
 205
205 -
 206
206 -
 207
207 -
 208
208 -
 209
209 -
 210
210 -
 211
211 -
 212
212 -
 213
213 -
 214
214 -
 215
215 -
 216
216 -
 217
217 -
 218
218 -
 219
219 -
 220
220 -
 221
221 -
222
-
223
-
224
-
225
-
226
-
227
-
228
-
229
-
230
-
231
-
232
-
233
-
234
-
235
-
236
-
237
-
238
-
239
-
240
-
241
-
242
-
243
-
244
-
245
-
246
-
247
-
248
-
249
-
250
-
251
-
252
-
253
-
254
-
255
-
256
-
257
-
258
-
259
-
260
-
261
-
262
-
263
-
264
-
265
-
266
-
267
-
268
 |
 |

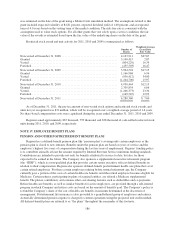
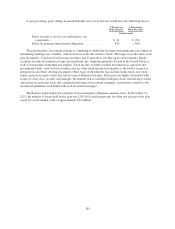
Effective April 16, 2009, future benefit accruals under the pension plan and the SERP were suspended for
all participants. Even during the suspension, participants continued to earn service toward vesting and eligibility
for early retirement benefits. Effective January 1, 2010, these benefit accruals were reinstated for pension plan
and SERP participants.
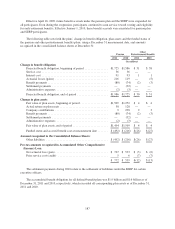
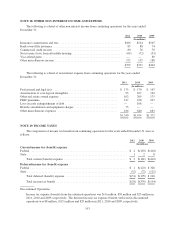
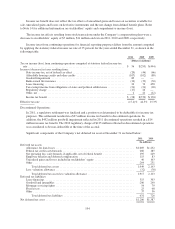
The following table sets forth the plans’ change in benefit obligation, plan assets and the funded status of
the pension and other postretirement benefits plans, using a December 31 measurement date, and amounts
recognized in the consolidated balance sheets at December 31:
Pension
Other
Postretirement Benefits
2011 2010 2011 2010
(In millions)
Change in benefit obligation
Projected benefit obligation, beginning of period ................ $1,725 $1,586 $ 31 $ 38
Service cost ............................................. 36 36 — —
Interest cost ............................................. 91 93 1 1
Actuarial losses (gains) .................................... 216 119 — (5)
Benefit payments ......................................... (80) (74) (2) (3)
Settlement payments ...................................... — (32) — —
Administrative expenses ................................... (2) (3) — —
Projected benefit obligation, end of period ..................... $1,986 $1,725 $ 30 $ 31
Change in plan assets
Fair value of plan assets, beginning of period ................... $1,509 $1,252 $ 4 $ 4
Actual return on plan assets ................................. 58 128 — —
Company contributions .................................... 9 238 2 3
Benefit payments ......................................... (80) (74) (2) (3)
Settlement payments ...................................... — (32) — —
Administrative expenses ................................... (2) (3) — —
Fair value of plan assets, end of period ........................ $1,494 $1,509 $ 4 $ 4
Funded status and accrued benefit cost at measurement date ....... $ (492) $ (216) $ (26) $ (27)
Amount recognized in the Consolidated Balance Sheets:
Other liabilities .......................................... $ (492) $ (216) $ (26) $ (27)
Pre-tax amounts recognized in Accumulated Other Comprehensive
(Income) Loss:
Net actuarial loss (gain) .................................... $ 767 $ 533 $ (5) $ (6)
Prior service cost (credit) .................................. 5 6 (7) (7)
$ 772 $ 539 $ (12) $ (13)
The settlement payments during 2010 relate to the settlement of liabilities under the SERP for certain
executive officers.
The accumulated benefit obligation for all defined-benefit plans was $1.9 billion and $1.6 billion as of
December 31, 2011 and 2010, respectively, which exceeded all corresponding plan assets as of December 31,
2011 and 2010.
187