Regions Bank 2011 Annual Report Download - page 178
Download and view the complete annual report
Please find page 178 of the 2011 Regions Bank annual report below. You can navigate through the pages in the report by either clicking on the pages listed below, or by using the keyword search tool below to find specific information within the annual report.-
 1
1 -
2
-
3
-
4
-
5
-
6
-
7
-
8
-
9
-
10
-
11
-
12
-
13
-
14
-
15
-
16
-
17
-
18
-
19
-
20
-
21
-
22
-
23
-
24
-
25
-
26
-
27
-
28
-
29
-
30
-
31
-
32
-
33
-
34
-
35
-
36
-
37
-
38
-
39
-
40
-
41
-
42
-
43
-
44
-
45
-
46
-
47
-
48
-
49
-
50
-
51
-
52
-
53
-
54
-
55
-
56
-
57
-
58
-
59
-
60
-
61
-
62
-
63
-
64
-
65
-
66
-
67
-
68
-
69
-
70
-
71
-
72
-
73
-
74
-
75
-
76
-
77
-
78
-
79
-
80
-
81
-
82
-
83
-
84
-
85
-
86
-
87
-
88
-
89
-
90
-
91
-
92
-
93
-
94
-
95
-
96
-
97
-
98
-
99
-
100
-
101
-
102
-
103
-
104
-
105
-
106
-
107
-
108
-
109
-
110
-
111
-
112
-
113
-
114
-
115
-
116
-
117
-
118
-
119
-
120
-
121
-
122
-
123
-
124
-
125
-
126
-
127
-
128
-
129
-
130
-
131
-
132
-
133
-
134
-
135
-
136
-
137
-
138
-
139
-
140
-
141
-
142
-
143
-
144
-
145
-
146
-
147
-
148
-
149
-
150
-
151
-
152
-
153
-
154
-
155
-
156
-
157
-
158
-
159
-
160
-
161
-
162
-
163
-
164
-
165
-
166
-
167
-
 168
168 -
 169
169 -
 170
170 -
 171
171 -
 172
172 -
 173
173 -
 174
174 -
 175
175 -
 176
176 -
 177
177 -
 178
178 -
 179
179 -
 180
180 -
 181
181 -
 182
182 -
 183
183 -
 184
184 -
 185
185 -
 186
186 -
 187
187 -
 188
188 -
189
-
190
-
191
-
192
-
193
-
194
-
195
-
196
-
197
-
198
-
199
-
200
-
201
-
202
-
203
-
204
-
205
-
206
-
207
-
208
-
209
-
210
-
211
-
212
-
213
-
214
-
215
-
216
-
217
-
218
-
219
-
220
-
221
-
222
-
223
-
224
-
225
-
226
-
227
-
228
-
229
-
230
-
231
-
232
-
233
-
234
-
235
-
236
-
237
-
238
-
239
-
240
-
241
-
242
-
243
-
244
-
245
-
246
-
247
-
248
-
249
-
250
-
251
-
252
-
253
-
254
-
255
-
256
-
257
-
258
-
259
-
260
-
261
-
262
-
263
-
264
-
265
-
266
-
267
-
268
 |
 |

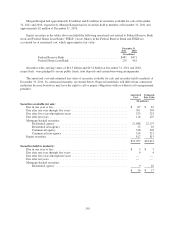
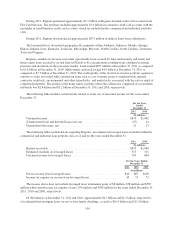
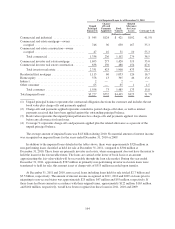
During 2011, Regions purchased approximately $1.1 billion of Regions-branded credit card accounts from
FIA Card Services. The purchase included approximately $1.0 billion in consumer credit card accounts with the
remainder in small business credit card accounts, which are included in the commercial and industrial portfolio
class.
During 2011, Regions also purchased approximately $675 million in indirect loans from a third party.
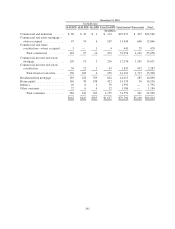
The loan portfolio is diversified geographically, primarily within Alabama, Arkansas, Florida, Georgia,
Illinois, Indiana, Iowa, Kentucky, Louisiana, Mississippi, Missouri, North Carolina, South Carolina, Tennessee,
Texas and Virginia.
Regions considers its investor real estate (specifically loans secured by land, multi-family and retail) and
home equity loans secured by second liens in Florida to be concentrations resulting from continued economic
pressures and downturns in the real estate market. Land totaled $857 million at December 31, 2011 as compared
to $1.6 billion at December 31, 2010. Multi-family and retail totaled $4.9 billion at December 31, 2011 as
compared to $7.3 billion at December 31, 2010. The credit quality of the investor real estate portfolio segment is
sensitive to risks associated with construction loans such as cost overruns, project completion risk, general
contractor credit risk, environmental and other hazard risks, and market risks associated with the sale or rental of
completed properties. The portion of the home equity portfolio where the collateral is comprised of second liens
in Florida was $2.8 billion and $3.2 billion at December 31, 2011 and 2010, respectively.
The following table includes certain details related to loans, net of unearned income for the years ended
December 31:
For the Years
Ended
December 31
2011 2010
(In millions)
Unearned income ..................................................... $870 $1,042
(Unamortized fees) and deferred loan costs, net ............................. (27) 14
Unamortized discounts, net ............................................. 21 23
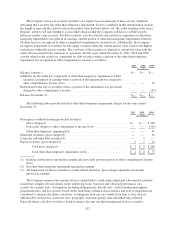
The following tables include details regarding Regions’ investment in leveraged leases included within the
commercial and industrial loan portfolio class as of and for the years ended December 31:
2011 2010
(In millions)
Rentals receivable .................................................... $855 $1,040
Estimated residuals on leveraged leases ................................... 315 315
Unearned income on leveraged leases ..................................... 703 844
For the Years Ended
December 31
2011 2010 2009
(In millions)
Pre-tax income from leveraged leases ................................. $46 $67 $100
Income tax expense on income from leveraged leases ..................... 45 53 72
The income above does not include leveraged lease termination gains of $8 million, $78 million and $587
million with related income tax expense of zero, $74 million and $589 million for the years ended December 31,
2011, 2010 and 2009, respectively.
Of the balances at December 31, 2011 and 2010, approximately $4.3 billion and $2.3 billion, respectively,
of residential first mortgage loans on one-to-four family dwellings, as well as $10.4 billion and $11.5 billion,
154