Regions Bank 2011 Annual Report Download - page 116
Download and view the complete annual report
Please find page 116 of the 2011 Regions Bank annual report below. You can navigate through the pages in the report by either clicking on the pages listed below, or by using the keyword search tool below to find specific information within the annual report.-
 1
1 -
2
-
3
-
4
-
5
-
6
-
7
-
8
-
9
-
10
-
11
-
12
-
13
-
14
-
15
-
16
-
17
-
18
-
19
-
20
-
21
-
22
-
23
-
24
-
25
-
26
-
27
-
28
-
29
-
30
-
31
-
32
-
33
-
34
-
35
-
36
-
37
-
38
-
39
-
40
-
41
-
42
-
43
-
44
-
45
-
46
-
47
-
48
-
49
-
50
-
51
-
52
-
53
-
54
-
55
-
56
-
57
-
58
-
59
-
60
-
61
-
62
-
63
-
64
-
65
-
66
-
67
-
68
-
69
-
70
-
71
-
72
-
73
-
74
-
75
-
76
-
77
-
78
-
79
-
80
-
81
-
82
-
83
-
84
-
85
-
86
-
87
-
88
-
89
-
90
-
91
-
92
-
93
-
94
-
95
-
96
-
97
-
98
-
99
-
100
-
101
-
102
-
103
-
104
-
105
-
 106
106 -
 107
107 -
 108
108 -
 109
109 -
 110
110 -
 111
111 -
 112
112 -
 113
113 -
 114
114 -
 115
115 -
 116
116 -
 117
117 -
 118
118 -
 119
119 -
 120
120 -
 121
121 -
 122
122 -
 123
123 -
 124
124 -
 125
125 -
 126
126 -
127
-
128
-
129
-
130
-
131
-
132
-
133
-
134
-
135
-
136
-
137
-
138
-
139
-
140
-
141
-
142
-
143
-
144
-
145
-
146
-
147
-
148
-
149
-
150
-
151
-
152
-
153
-
154
-
155
-
156
-
157
-
158
-
159
-
160
-
161
-
162
-
163
-
164
-
165
-
166
-
167
-
168
-
169
-
170
-
171
-
172
-
173
-
174
-
175
-
176
-
177
-
178
-
179
-
180
-
181
-
182
-
183
-
184
-
185
-
186
-
187
-
188
-
189
-
190
-
191
-
192
-
193
-
194
-
195
-
196
-
197
-
198
-
199
-
200
-
201
-
202
-
203
-
204
-
205
-
206
-
207
-
208
-
209
-
210
-
211
-
212
-
213
-
214
-
215
-
216
-
217
-
218
-
219
-
220
-
221
-
222
-
223
-
224
-
225
-
226
-
227
-
228
-
229
-
230
-
231
-
232
-
233
-
234
-
235
-
236
-
237
-
238
-
239
-
240
-
241
-
242
-
243
-
244
-
245
-
246
-
247
-
248
-
249
-
250
-
251
-
252
-
253
-
254
-
255
-
256
-
257
-
258
-
259
-
260
-
261
-
262
-
263
-
264
-
265
-
266
-
267
-
268
 |
 |

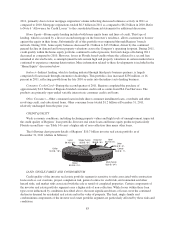
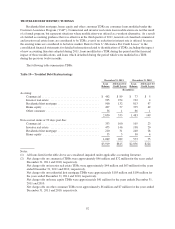
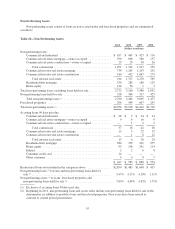
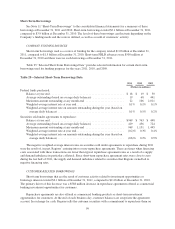
TROUBLED DEBT RESTRUCTURINGS
Residential first mortgage, home equity and other consumer TDRs are consumer loans modified under the
Customer Assistance Program (“CAP”). Commercial and investor real estate loan modifications are not the result
of a formal program, but represent situations where modification was offered as a workout alternative. As a result
of clarified accounting guidance that was effective in the third quarter of 2011, renewals of classified commercial
and investor real estate loans are considered to be TDRs, even if no reduction in interest rate is offered, because
the existing terms are considered to be below market. Refer to Note 6 “Allowance For Credit Losses” to the
consolidated financial statements for detailed information related to identification of TDRs, including the impact
of new accounting literature adopted during 2011, loans modified in a TDR during the period and the financial
impact of those modifications, and loans which defaulted during the period which were modified in a TDR
during the previous twelve months.
The following table summarizes TDRs:
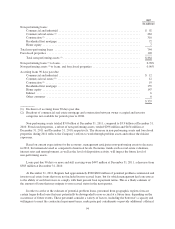
Table 19—Troubled Debt Restructurings
December 31, 2011 December 31, 2010
Loan
Balance
Allowance for
Credit Losses
Loan
Balance
Allowance for
Credit Losses
(In millions)
Accruing:
Commercial ....................................... $ 492 $ 89 $ 77 $ 5
Investor real estate ................................. 995 254 192 4
Residential first mortgage ............................ 900 132 813 97
Home equity ...................................... 407 57 335 42
Other consumer .................................... 56 1 66 1
2,850 533 1,483 149
Non-accrual status or 90 days past due:
Commercial ....................................... 353 100 105 23
Investor real estate ................................. 473 146 198 20
Residential first mortgage ............................ 210 31 240 28
Home equity ...................................... 33 5 30 4
1,069 282 573 75
$3,919 $815 $2,056 $224
Notes:
(1) All loans listed in the table above are considered impaired under applicable accounting literature.
(2) Net charge-offs on commercial TDRs were approximately $46 million and $72 million for the years ended
December 31, 2011 and 2010, respectively.
Net charge-offs on investor real estate TDRs were approximately $44 million and $63 million for the years
ended December 31, 2011 and 2010, respectively.
Net charge-offs on residential first mortgage TDRs were approximately $103 million and $109 million for
the years ended December 31, 2011 and 2010, respectively.
Net charge-offs on home equity TDRs were approximately $41 million for the years endeds December 31,
2011 and 2010.
Net charge-offs on other consumer TDRs were approximately $6 million and $7 million for the years ended
December 31, 2011 and 2010, respectively.
92