Regions Bank 2011 Annual Report Download - page 95
Download and view the complete annual report
Please find page 95 of the 2011 Regions Bank annual report below. You can navigate through the pages in the report by either clicking on the pages listed below, or by using the keyword search tool below to find specific information within the annual report.-
 1
1 -
2
-
3
-
4
-
5
-
6
-
7
-
8
-
9
-
10
-
11
-
12
-
13
-
14
-
15
-
16
-
17
-
18
-
19
-
20
-
21
-
22
-
23
-
24
-
25
-
26
-
27
-
28
-
29
-
30
-
31
-
32
-
33
-
34
-
35
-
36
-
37
-
38
-
39
-
40
-
41
-
42
-
43
-
44
-
45
-
46
-
47
-
48
-
49
-
50
-
51
-
52
-
53
-
54
-
55
-
56
-
57
-
58
-
59
-
60
-
61
-
62
-
63
-
64
-
65
-
66
-
67
-
68
-
69
-
70
-
71
-
72
-
73
-
74
-
75
-
76
-
77
-
78
-
79
-
80
-
81
-
82
-
83
-
84
-
 85
85 -
 86
86 -
 87
87 -
 88
88 -
 89
89 -
 90
90 -
 91
91 -
 92
92 -
 93
93 -
 94
94 -
 95
95 -
 96
96 -
 97
97 -
 98
98 -
 99
99 -
 100
100 -
 101
101 -
 102
102 -
 103
103 -
 104
104 -
 105
105 -
106
-
107
-
108
-
109
-
110
-
111
-
112
-
113
-
114
-
115
-
116
-
117
-
118
-
119
-
120
-
121
-
122
-
123
-
124
-
125
-
126
-
127
-
128
-
129
-
130
-
131
-
132
-
133
-
134
-
135
-
136
-
137
-
138
-
139
-
140
-
141
-
142
-
143
-
144
-
145
-
146
-
147
-
148
-
149
-
150
-
151
-
152
-
153
-
154
-
155
-
156
-
157
-
158
-
159
-
160
-
161
-
162
-
163
-
164
-
165
-
166
-
167
-
168
-
169
-
170
-
171
-
172
-
173
-
174
-
175
-
176
-
177
-
178
-
179
-
180
-
181
-
182
-
183
-
184
-
185
-
186
-
187
-
188
-
189
-
190
-
191
-
192
-
193
-
194
-
195
-
196
-
197
-
198
-
199
-
200
-
201
-
202
-
203
-
204
-
205
-
206
-
207
-
208
-
209
-
210
-
211
-
212
-
213
-
214
-
215
-
216
-
217
-
218
-
219
-
220
-
221
-
222
-
223
-
224
-
225
-
226
-
227
-
228
-
229
-
230
-
231
-
232
-
233
-
234
-
235
-
236
-
237
-
238
-
239
-
240
-
241
-
242
-
243
-
244
-
245
-
246
-
247
-
248
-
249
-
250
-
251
-
252
-
253
-
254
-
255
-
256
-
257
-
258
-
259
-
260
-
261
-
262
-
263
-
264
-
265
-
266
-
267
-
268
 |
 |
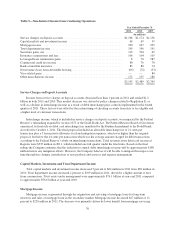
rights and related derivatives which added $16 million of non-interest income in 2010 compared to a $22 million
loss in 2011. See Note 7 “Servicing of Financial Assets” to the consolidated financial statements for further
detail. Mortgage originations totaled $6.3 billion in 2011 as compared to $8.2 billion in 2010. Mortgage
originations were higher in 2010 due to more refinancing activity. In 2010, refinancing encompassed 62 percent
of mortgage originations versus 54 percent in 2011.
Effective January 1, 2009, Regions made an election to prospectively change the policy for accounting for
residential mortgage servicing rights from the amortization method to the fair value measurement method. Under
the fair value measurement method, servicing assets are measured at fair value each period with changes in fair
value recorded as a component of mortgage banking income. Regions uses various derivative instruments to
mitigate the effect of changes in the fair value of its mortgage servicing rights. Beginning in the fourth quarter of
2009, the Company also began using trading assets to mitigate the impact of changes in the fair value of its
mortgage servicing rights. Because changes in value of trading assets are reported in capital markets and
investment income, and because earnings on these assets are reported in net interest income, the total effect of
mortgage servicing rights and related hedging instruments impacts several line items in the statements of
operations. See Note 7 “Servicing of Financial Assets” to the consolidated financial statements for further detail.
At December 31, 2011, Regions’ servicing portfolio totaled $41.1 billion, $26.7 billion of which was
serviced for third parties. At December 31, 2010, the servicing portfolio totaled $41.7 billion, $26.0 billion of
which was serviced for third parties.
Securities Gains, Net
Regions reported net gains of $112 million from the sale of securities available for sale in 2011, as
compared to net gains of $394 million in 2010. The Company’s gains for both years were due to increased sales
activity within the available for sale category as part of the Company’s asset/liability management strategies. In
2011, the Company repositioned its securities portfolio and sold $7.7 billion of securities that were primarily
agency available for sale securities. The proceeds were reinvested predominantly into similar securities with
shorter durations. In 2010, the Company repositioned its securities portfolio and sold $9.9 billion of securities to
mitigate prepayment risk and extended the duration on the investment portfolio. The proceeds from the sales in
2011 and 2010 were primarily reinvested in U.S. government agency mortgage-backed securities classified as
available for sale. Refer to the “Securities” section in the “Balance Sheet Analysis” for further discussion.
Leveraged Lease Termination Gains
A 2008 settlement with the Internal Revenue Service negatively impacted the economics of Regions’
leveraged lease portfolio. In addition, there was a mutual desire with lessees to terminate certain leases within
this portfolio. Accordingly, the Company decided to terminate certain of these leases in 2011 and 2010, resulting
in gains of $8 million and $78 million, respectively. However, the 2010 gains were essentially offset by related
income tax expense of $74 million, resulting in a minimal impact to net income. There was no material impact to
income tax expense related to the 2011 gains.
Bank-Owned Life Insurance
Bank-owned life insurance income decreased 6 percent to $83 million in 2011, compared to $88 million in
2010. This decrease is primarily due to a decline in death benefits and crediting rates.
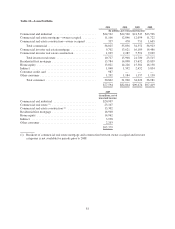
Other Miscellaneous Income
Other miscellaneous income increased $37 million to $172 million in 2011. The largest component of the
increase was credit card income which totaled $31 million in 2011 with no impact in 2010. In June 2011,
Regions purchased approximately $1.1 billion of Regions-branded credit card accounts from FIA Card Services.
71