Regions Bank 2011 Annual Report Download - page 203
Download and view the complete annual report
Please find page 203 of the 2011 Regions Bank annual report below. You can navigate through the pages in the report by either clicking on the pages listed below, or by using the keyword search tool below to find specific information within the annual report.-
 1
1 -
2
-
3
-
4
-
5
-
6
-
7
-
8
-
9
-
10
-
11
-
12
-
13
-
14
-
15
-
16
-
17
-
18
-
19
-
20
-
21
-
22
-
23
-
24
-
25
-
26
-
27
-
28
-
29
-
30
-
31
-
32
-
33
-
34
-
35
-
36
-
37
-
38
-
39
-
40
-
41
-
42
-
43
-
44
-
45
-
46
-
47
-
48
-
49
-
50
-
51
-
52
-
53
-
54
-
55
-
56
-
57
-
58
-
59
-
60
-
61
-
62
-
63
-
64
-
65
-
66
-
67
-
68
-
69
-
70
-
71
-
72
-
73
-
74
-
75
-
76
-
77
-
78
-
79
-
80
-
81
-
82
-
83
-
84
-
85
-
86
-
87
-
88
-
89
-
90
-
91
-
92
-
93
-
94
-
95
-
96
-
97
-
98
-
99
-
100
-
101
-
102
-
103
-
104
-
105
-
106
-
107
-
108
-
109
-
110
-
111
-
112
-
113
-
114
-
115
-
116
-
117
-
118
-
119
-
120
-
121
-
122
-
123
-
124
-
125
-
126
-
127
-
128
-
129
-
130
-
131
-
132
-
133
-
134
-
135
-
136
-
137
-
138
-
139
-
140
-
141
-
142
-
143
-
144
-
145
-
146
-
147
-
148
-
149
-
150
-
151
-
152
-
153
-
154
-
155
-
156
-
157
-
158
-
159
-
160
-
161
-
162
-
163
-
164
-
165
-
166
-
167
-
168
-
169
-
170
-
171
-
172
-
173
-
174
-
175
-
176
-
177
-
178
-
179
-
180
-
181
-
182
-
183
-
184
-
185
-
186
-
187
-
188
-
189
-
190
-
191
-
192
-
 193
193 -
 194
194 -
 195
195 -
 196
196 -
 197
197 -
 198
198 -
 199
199 -
 200
200 -
 201
201 -
 202
202 -
 203
203 -
 204
204 -
 205
205 -
 206
206 -
 207
207 -
 208
208 -
 209
209 -
 210
210 -
 211
211 -
 212
212 -
 213
213 -
214
-
215
-
216
-
217
-
218
-
219
-
220
-
221
-
222
-
223
-
224
-
225
-
226
-
227
-
228
-
229
-
230
-
231
-
232
-
233
-
234
-
235
-
236
-
237
-
238
-
239
-
240
-
241
-
242
-
243
-
244
-
245
-
246
-
247
-
248
-
249
-
250
-
251
-
252
-
253
-
254
-
255
-
256
-
257
-
258
-
259
-
260
-
261
-
262
-
263
-
264
-
265
-
266
-
267
-
268
 |
 |

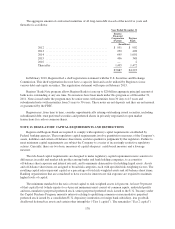
may consist of a limited amount of other preferred stock, mandatorily convertible securities, subordinated debt,
and a limited amount of the allowance for loan losses. The sum of Tier 1 capital and Tier 2 capital is “total risk-
based capital” or total capital. However, under the Collins Amendment, that was passed as a section of the Dodd-
Frank Act, trust preferred securities will be eliminated as an element of Tier 1 capital. This disallowance of trust
preferred securities will be phased in from January 1, 2013 to January 1, 2016. Debt or equity instruments issued
to the Federal government as part of the CPP are exempt from the Collins Amendment. As of December 31,
2011, Regions had $846 million of trust preferred securities that are subject to the Collins Amendment and $3.5
billion of preferred equity that is exempt from the Collins Amendment.
The minimum guidelines to be considered well capitalized for Total capital and Tier 1 capital are 10 percent
and 6 percent, respectively. As of December 31, 2011 and 2010, the most recent notification from Federal banking
agencies categorized Regions and its significant subsidiaries as well capitalized under the regulatory framework.
The Company believes that no changes in conditions or events have occurred since December 31, 2011,
which would result in changes that would cause Regions or Regions Bank to fall below the well capitalized level.
The banking regulatory agencies also have adopted regulations that supplement the risk-based guidelines to
include a minimum ratio of 3 percent of Tier 1 capital to average assets less goodwill and disallowed deferred tax
assets (the “Leverage ratio”). Depending upon the risk profile of the institution and other factors, the regulatory
agencies may require a Leverage ratio of 1 percent to 2 percent above the minimum 3 percent level.
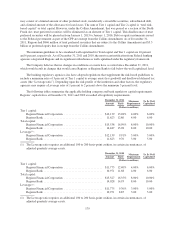
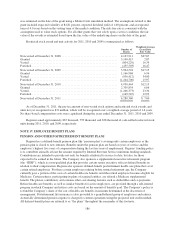
The following tables summarize the applicable holding company and bank regulatory capital requirements.
Regions’ capital ratios at December 31, 2011 and 2010 exceeded all regulatory requirements.
December 31, 2011 Minimum
Requirement
To Be Well
CapitalizedAmount Ratio
(Dollars in millions)
Tier 1 capital:
Regions Financial Corporation .......................... $12,139 13.28% 4.00% 6.00%
Regions Bank ........................................ 11,623 12.86 4.00 6.00
Total capital:
Regions Financial Corporation .......................... $15,538 16.99% 8.00% 10.00%
Regions Bank ........................................ 14,447 15.98 8.00 10.00
Leverage(1) :
Regions Financial Corporation .......................... $12,139 9.91% 3.00% 5.00%
Regions Bank ........................................ 11,623 9.76 3.00 5.00
(1) The Leverage ratio requires an additional 100 to 200 basis-point cushion, in certain circumstances, of
adjusted quarterly average assets.
December 31, 2010 Minimum
Requirement
To Be Well
CapitalizedAmount Ratio
(Dollars in millions)
Tier 1 capital:
Regions Financial Corporation .......................... $11,775 12.40% 4.00% 6.00%
Regions Bank ........................................ 10,971 11.68 4.00 6.00
Total capital:
Regions Financial Corporation .......................... $15,527 16.35% 8.00% 10.00%
Regions Bank ........................................ 14,028 14.93 8.00 10.00
Leverage(1) :
Regions Financial Corporation .......................... $11,775 9.30% 3.00% 5.00%
Regions Bank ........................................ 10,971 8.85 3.00 5.00
(1) The Leverage ratio requires an additional 100 to 200 basis-point cushion, in certain circumstances, of
adjusted quarterly average assets.
179