Regions Bank 2011 Annual Report Download - page 208
Download and view the complete annual report
Please find page 208 of the 2011 Regions Bank annual report below. You can navigate through the pages in the report by either clicking on the pages listed below, or by using the keyword search tool below to find specific information within the annual report.-
 1
1 -
2
-
3
-
4
-
5
-
6
-
7
-
8
-
9
-
10
-
11
-
12
-
13
-
14
-
15
-
16
-
17
-
18
-
19
-
20
-
21
-
22
-
23
-
24
-
25
-
26
-
27
-
28
-
29
-
30
-
31
-
32
-
33
-
34
-
35
-
36
-
37
-
38
-
39
-
40
-
41
-
42
-
43
-
44
-
45
-
46
-
47
-
48
-
49
-
50
-
51
-
52
-
53
-
54
-
55
-
56
-
57
-
58
-
59
-
60
-
61
-
62
-
63
-
64
-
65
-
66
-
67
-
68
-
69
-
70
-
71
-
72
-
73
-
74
-
75
-
76
-
77
-
78
-
79
-
80
-
81
-
82
-
83
-
84
-
85
-
86
-
87
-
88
-
89
-
90
-
91
-
92
-
93
-
94
-
95
-
96
-
97
-
98
-
99
-
100
-
101
-
102
-
103
-
104
-
105
-
106
-
107
-
108
-
109
-
110
-
111
-
112
-
113
-
114
-
115
-
116
-
117
-
118
-
119
-
120
-
121
-
122
-
123
-
124
-
125
-
126
-
127
-
128
-
129
-
130
-
131
-
132
-
133
-
134
-
135
-
136
-
137
-
138
-
139
-
140
-
141
-
142
-
143
-
144
-
145
-
146
-
147
-
148
-
149
-
150
-
151
-
152
-
153
-
154
-
155
-
156
-
157
-
158
-
159
-
160
-
161
-
162
-
163
-
164
-
165
-
166
-
167
-
168
-
169
-
170
-
171
-
172
-
173
-
174
-
175
-
176
-
177
-
178
-
179
-
180
-
181
-
182
-
183
-
184
-
185
-
186
-
187
-
188
-
189
-
190
-
191
-
192
-
193
-
194
-
195
-
196
-
197
-
 198
198 -
 199
199 -
 200
200 -
 201
201 -
 202
202 -
 203
203 -
 204
204 -
 205
205 -
 206
206 -
 207
207 -
 208
208 -
 209
209 -
 210
210 -
 211
211 -
 212
212 -
 213
213 -
 214
214 -
 215
215 -
 216
216 -
 217
217 -
 218
218 -
219
-
220
-
221
-
222
-
223
-
224
-
225
-
226
-
227
-
228
-
229
-
230
-
231
-
232
-
233
-
234
-
235
-
236
-
237
-
238
-
239
-
240
-
241
-
242
-
243
-
244
-
245
-
246
-
247
-
248
-
249
-
250
-
251
-
252
-
253
-
254
-
255
-
256
-
257
-
258
-
259
-
260
-
261
-
262
-
263
-
264
-
265
-
266
-
267
-
268
 |
 |

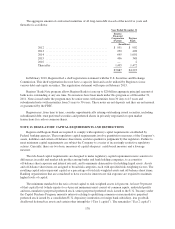
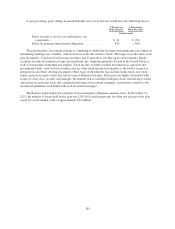
On May 13, 2010, the shareholders of the Company approved the Regions Financial Corporation 2010
Long-Term Incentive Plan (“2010 LTIP”), which permits the Company to grant to employees and directors
various forms of incentive compensation. These forms of incentive compensation are similar to the types of
compensation approved in prior plans. The 2010 LTIP authorizes 100 million common share equivalents
available for grant, where grants of options count as one share equivalent and grants of full value awards (e.g.,
shares of restricted stock and restricted stock units) count as 2.25 share equivalents. Unless otherwise determined
by the Compensation Committee of the Board of Directors, grants of restricted stock and restricted stock units
accrue dividends as they are declared by the Board of Directors, and the dividends are paid upon vesting of the
award. The 2010 LTIP closed all prior long-term incentive plans to new grants, and accordingly, prospective
grants must be made under the 2010 LTIP or a successor plan. All existing grants under prior long-term incentive
plans were unaffected by this amendment. The number of remaining share equivalents available for future
issuance under the 2010 LTIP was approximately 84 million at December 31, 2011.
Grants of performance-based restricted stock typically have a one-year performance period, after which
shares vest within three years after the grant date. Restricted stock units, which were granted in 2008, have a
vesting period of five years. Generally, the terms of these plans stipulate that the exercise price of options may
not be less than the fair market value of Regions’ common stock at the date the options are granted; however,
under prior stock option plans, non-qualified options could be granted with a lower exercise price than the fair
market value of Regions’ common stock on the date of grant. The contractual life of options granted under these
plans ranges from seven to ten years from the date of grant. Regions issues new shares from authorized reserves
upon exercise. Grantees of restricted stock awards or units must either remain employed with the Company for
certain periods from the date of grant in order for shares to be released or issued or retire after meeting the
standards of a retiree, at which time shares would be prorated and released.
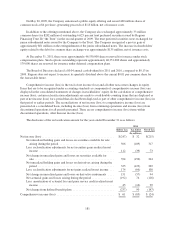
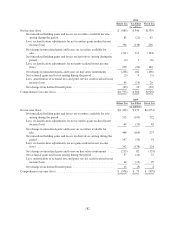
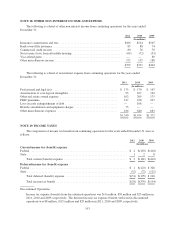
The following table summarizes the elements of compensation cost recognized in the consolidated
statements of operations for the years ended December 31:
2011 2010 2009
(In millions)
Compensation cost of share-based compensation awards:
Restricted stock awards ........................................ $10 $10 $33
Stock options ................................................ 9 13 14
Cash-settled restricted stock units ................................ 3 7 3
Tax benefits related to compensation cost .............................. (8) (11) (18)
Compensation cost of share-based compensation awards, net of tax ......... $14 $19 $32
Note: The table above includes compensation cost of share-based compensation awards from discontinued
operations of approximately $1 million, net of tax, for years 2011, 2010 and 2009 (see Note 3 to the consolidated
financial statements) .
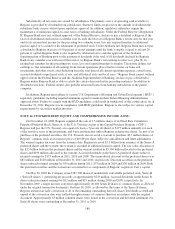
STOCK OPTIONS
During 2011 and 2010, Regions made stock option grants that vest based upon a service condition. The fair
value of these stock options was estimated on the date of the grant using a Black-Scholes option pricing model
and related assumptions. The stock options vest ratably over a three-year term. During 2009, Regions made stock
option grants from prior long-term incentive plans that vest based upon a service condition and a market
condition in addition to awards that were similar to prior grants. The fair value of these stock options was
estimated on the date of the grant using a Monte-Carlo simulation method. The simulation generates a defined
number of stock price paths in order to develop a reasonable estimate of the range of future expected stock prices
and minimize standard error.
184