Regions Bank 2011 Annual Report Download - page 104
Download and view the complete annual report
Please find page 104 of the 2011 Regions Bank annual report below. You can navigate through the pages in the report by either clicking on the pages listed below, or by using the keyword search tool below to find specific information within the annual report.-
 1
1 -
2
-
3
-
4
-
5
-
6
-
7
-
8
-
9
-
10
-
11
-
12
-
13
-
14
-
15
-
16
-
17
-
18
-
19
-
20
-
21
-
22
-
23
-
24
-
25
-
26
-
27
-
28
-
29
-
30
-
31
-
32
-
33
-
34
-
35
-
36
-
37
-
38
-
39
-
40
-
41
-
42
-
43
-
44
-
45
-
46
-
47
-
48
-
49
-
50
-
51
-
52
-
53
-
54
-
55
-
56
-
57
-
58
-
59
-
60
-
61
-
62
-
63
-
64
-
65
-
66
-
67
-
68
-
69
-
70
-
71
-
72
-
73
-
74
-
75
-
76
-
77
-
78
-
79
-
80
-
81
-
82
-
83
-
84
-
85
-
86
-
87
-
88
-
89
-
90
-
91
-
92
-
93
-
 94
94 -
 95
95 -
 96
96 -
 97
97 -
 98
98 -
 99
99 -
 100
100 -
 101
101 -
 102
102 -
 103
103 -
 104
104 -
 105
105 -
 106
106 -
 107
107 -
 108
108 -
 109
109 -
 110
110 -
 111
111 -
 112
112 -
 113
113 -
 114
114 -
115
-
116
-
117
-
118
-
119
-
120
-
121
-
122
-
123
-
124
-
125
-
126
-
127
-
128
-
129
-
130
-
131
-
132
-
133
-
134
-
135
-
136
-
137
-
138
-
139
-
140
-
141
-
142
-
143
-
144
-
145
-
146
-
147
-
148
-
149
-
150
-
151
-
152
-
153
-
154
-
155
-
156
-
157
-
158
-
159
-
160
-
161
-
162
-
163
-
164
-
165
-
166
-
167
-
168
-
169
-
170
-
171
-
172
-
173
-
174
-
175
-
176
-
177
-
178
-
179
-
180
-
181
-
182
-
183
-
184
-
185
-
186
-
187
-
188
-
189
-
190
-
191
-
192
-
193
-
194
-
195
-
196
-
197
-
198
-
199
-
200
-
201
-
202
-
203
-
204
-
205
-
206
-
207
-
208
-
209
-
210
-
211
-
212
-
213
-
214
-
215
-
216
-
217
-
218
-
219
-
220
-
221
-
222
-
223
-
224
-
225
-
226
-
227
-
228
-
229
-
230
-
231
-
232
-
233
-
234
-
235
-
236
-
237
-
238
-
239
-
240
-
241
-
242
-
243
-
244
-
245
-
246
-
247
-
248
-
249
-
250
-
251
-
252
-
253
-
254
-
255
-
256
-
257
-
258
-
259
-
260
-
261
-
262
-
263
-
264
-
265
-
266
-
267
-
268
 |
 |
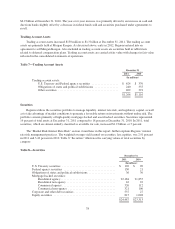
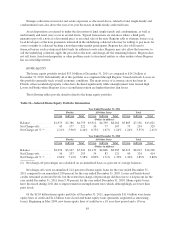
Portfolio Quality—Regions’ investment policy emphasizes credit quality and liquidity. Securities rated in
the highest category by nationally recognized rating agencies and securities backed by the U.S. Government and
government sponsored agencies, both on a direct and indirect basis, represented approximately 97 percent of the
investment portfolio at December 31, 2011. All other securities rated below AAA, not backed by the U.S.
Government or government sponsored agencies, or which are not rated represented less than 3 percent of total
securities at year-end 2011.
Loans Held for Sale
At December 31, 2011, loans held for sale totaled $1.2 billion, consisting of $844 million of residential real
estate mortgage loans and $328 million of non-performing investor real estate loans. At December 31, 2010,
loans held for sale totaled $1.5 billion, consisting of $1.2 billion of residential real estate mortgage loans and
$304 million of non-performing investor real estate loans. The level of residential real estate mortgage loans held
for sale fluctuates depending on the timing of origination and sale to third parties.
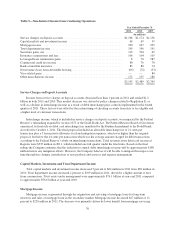
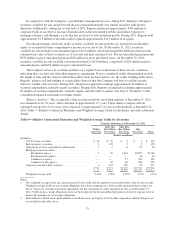
Loans
GENERAL
Average loans, net of unearned income, represented 72 percent of average interest-earning assets from
continuing operations for the year ended December 31, 2011, compared to 74 percent for the year ended
December 31, 2010. Lending at Regions is generally organized along three portfolio segments: commercial
(including commercial and industrial, and owner occupied commercial real estate mortgage and construction
loans), investor real estate loans (commercial real estate mortgage and construction loans) and consumer loans
(residential first mortgage, home equity, indirect, consumer credit card and other consumer loans).
Regions manages loan growth with a focus on risk management and risk-adjusted return on capital.
Strategic decisions to reduce the concentration in investor real estate, sales of residential mortgage loans, and
lower demand for home equity products were the primary contributors to the decrease. The decrease was partially
offset by increases in commercial and industrial loans and indirect automobile lending as well as the purchase of
Regions-branded credit card loans during the second quarter of 2011.
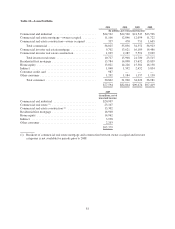
Table 10 illustrates a year-over-year comparison of loans by portfolio segment and class and Table 11
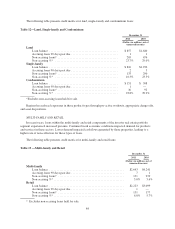
provides information on selected loan maturities.
80