Regions Bank 2011 Annual Report Download - page 134
Download and view the complete annual report
Please find page 134 of the 2011 Regions Bank annual report below. You can navigate through the pages in the report by either clicking on the pages listed below, or by using the keyword search tool below to find specific information within the annual report.-
 1
1 -
2
-
3
-
4
-
5
-
6
-
7
-
8
-
9
-
10
-
11
-
12
-
13
-
14
-
15
-
16
-
17
-
18
-
19
-
20
-
21
-
22
-
23
-
24
-
25
-
26
-
27
-
28
-
29
-
30
-
31
-
32
-
33
-
34
-
35
-
36
-
37
-
38
-
39
-
40
-
41
-
42
-
43
-
44
-
45
-
46
-
47
-
48
-
49
-
50
-
51
-
52
-
53
-
54
-
55
-
56
-
57
-
58
-
59
-
60
-
61
-
62
-
63
-
64
-
65
-
66
-
67
-
68
-
69
-
70
-
71
-
72
-
73
-
74
-
75
-
76
-
77
-
78
-
79
-
80
-
81
-
82
-
83
-
84
-
85
-
86
-
87
-
88
-
89
-
90
-
91
-
92
-
93
-
94
-
95
-
96
-
97
-
98
-
99
-
100
-
101
-
102
-
103
-
104
-
105
-
106
-
107
-
108
-
109
-
110
-
111
-
112
-
113
-
114
-
115
-
116
-
117
-
118
-
119
-
120
-
121
-
122
-
123
-
 124
124 -
 125
125 -
 126
126 -
 127
127 -
 128
128 -
 129
129 -
 130
130 -
 131
131 -
 132
132 -
 133
133 -
 134
134 -
 135
135 -
 136
136 -
 137
137 -
 138
138 -
 139
139 -
 140
140 -
 141
141 -
 142
142 -
 143
143 -
 144
144 -
145
-
146
-
147
-
148
-
149
-
150
-
151
-
152
-
153
-
154
-
155
-
156
-
157
-
158
-
159
-
160
-
161
-
162
-
163
-
164
-
165
-
166
-
167
-
168
-
169
-
170
-
171
-
172
-
173
-
174
-
175
-
176
-
177
-
178
-
179
-
180
-
181
-
182
-
183
-
184
-
185
-
186
-
187
-
188
-
189
-
190
-
191
-
192
-
193
-
194
-
195
-
196
-
197
-
198
-
199
-
200
-
201
-
202
-
203
-
204
-
205
-
206
-
207
-
208
-
209
-
210
-
211
-
212
-
213
-
214
-
215
-
216
-
217
-
218
-
219
-
220
-
221
-
222
-
223
-
224
-
225
-
226
-
227
-
228
-
229
-
230
-
231
-
232
-
233
-
234
-
235
-
236
-
237
-
238
-
239
-
240
-
241
-
242
-
243
-
244
-
245
-
246
-
247
-
248
-
249
-
250
-
251
-
252
-
253
-
254
-
255
-
256
-
257
-
258
-
259
-
260
-
261
-
262
-
263
-
264
-
265
-
266
-
267
-
268
 |
 |
such, the contract amounts do not necessarily represent future cash requirements. Settlement of the transactions
relating to such commitments is not expected to have a material effect on Regions’ consolidated financial
position. Transactions involving future settlement give rise to market risk, which represents the potential gain or
loss that can be caused by a change in the market value of a particular financial instrument. Regions’ exposure to
market risk is determined by a number of factors, including the size, composition and diversification of positions
held, the absolute and relative levels of interest rates, and market volatility.
Additionally, in the normal course of business, Morgan Keegan enters into transactions for delayed delivery,
to-be-announced securities, which are recorded in trading account assets on the consolidated balance sheets at
fair value. Risks arise from the possible inability of counterparties to meet the terms of their contracts and from
unfavorable changes in interest rates or the market values of the securities underlying the instruments. The credit
risk associated with these contracts is typically limited to the cost of replacing all contracts on which Morgan
Keegan has recorded an unrealized gain. For exchange-traded contracts, the clearing organization acts as the
counterparty to specific transactions and, therefore, bears the risk of delivery to and from counterparties.
Interest rate risk at Morgan Keegan arises from the exposure of holding interest-sensitive financial instruments
such as government, corporate and municipal bonds, and certain preferred equities. Morgan Keegan manages its
exposure to interest rate risk by setting and monitoring limits and, where feasible, entering into offsetting positions
in securities with similar interest rate risk characteristics. Securities inventories recorded in trading account assets
on the consolidated balance sheet, are marked to market, and, accordingly, there are no unrecorded gains or losses in
value. While a significant portion of the securities inventories have contractual maturities in excess of five years,
these inventories, on average, turn over in excess of twelve times per year. Accordingly, the exposure to interest rate
risk inherent in Morgan Keegan’s securities inventories is less than that of similar financial instruments held by
firms in other industries. Morgan Keegan’s equity securities inventories are exposed to risk of loss in the event of
unfavorable price movements. Also, Morgan Keegan is subject to credit risk arising from non-performance by
trading counterparties, customers and issuers of debt securities owned. This risk is managed by imposing and
monitoring position limits, monitoring trading counterparties, reviewing security concentrations, holding and
marking to market collateral, and conducting business through clearing organizations that guarantee performance.
Morgan Keegan regularly participates in the trading of some derivative securities for its customers; however, this
activity does not involve Morgan Keegan acquiring a position or commitment in these products and this trading is
not a significant portion of Morgan Keegan’s business.
Morgan Keegan has been an underwriter and dealer in auction rate securities. See Note 23 “Commitments,
Contingencies and Guarantees” to the consolidated financial statements for more details regarding regulatory
action related to Morgan Keegan auction rate securities. As of December 31, 2011, customers of Morgan Keegan
owned approximately $675 thousand of auction rate securities, and Morgan Keegan held approximately $135
million of auction rate securities on the balance sheet.
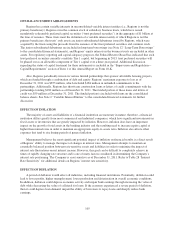
To manage trading risks arising from interest rate and equity price risks, Regions uses a Value at Risk
(“VAR”) model along with other risk management methods to measure the potential fair value the Company
could lose on its trading positions given a specified statistical confidence level and time-to-liquidate time
horizon. The end-of-period VAR was approximately $423 thousand at December 31, 2011 and $805 thousand at
December 31, 2010. Maximum daily VAR utilization during 2011 was $1.7 million and average daily VAR
during the same period was $782 thousand.
LIQUIDITY RISK
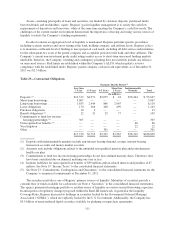
Liquidity is an important factor in the financial condition of Regions and affects Regions’ ability to meet the
borrowing needs and deposit withdrawal requirements of its customers. Regions intends to fund obligations
primarily through cash generated from normal operations. In addition to these obligations, Regions has
obligations related to potential litigation contingencies. See Note 23 “Commitments, Contingencies and
Guarantees” to the consolidated financial statements for additional discussion of the Company’s funding
requirements.
110