Regions Bank 2011 Annual Report Download - page 89
Download and view the complete annual report
Please find page 89 of the 2011 Regions Bank annual report below. You can navigate through the pages in the report by either clicking on the pages listed below, or by using the keyword search tool below to find specific information within the annual report.-
 1
1 -
2
-
3
-
4
-
5
-
6
-
7
-
8
-
9
-
10
-
11
-
12
-
13
-
14
-
15
-
16
-
17
-
18
-
19
-
20
-
21
-
22
-
23
-
24
-
25
-
26
-
27
-
28
-
29
-
30
-
31
-
32
-
33
-
34
-
35
-
36
-
37
-
38
-
39
-
40
-
41
-
42
-
43
-
44
-
45
-
46
-
47
-
48
-
49
-
50
-
51
-
52
-
53
-
54
-
55
-
56
-
57
-
58
-
59
-
60
-
61
-
62
-
63
-
64
-
65
-
66
-
67
-
68
-
69
-
70
-
71
-
72
-
73
-
74
-
75
-
76
-
77
-
78
-
 79
79 -
 80
80 -
 81
81 -
 82
82 -
 83
83 -
 84
84 -
 85
85 -
 86
86 -
 87
87 -
 88
88 -
 89
89 -
 90
90 -
 91
91 -
 92
92 -
 93
93 -
 94
94 -
 95
95 -
 96
96 -
 97
97 -
 98
98 -
 99
99 -
100
-
101
-
102
-
103
-
104
-
105
-
106
-
107
-
108
-
109
-
110
-
111
-
112
-
113
-
114
-
115
-
116
-
117
-
118
-
119
-
120
-
121
-
122
-
123
-
124
-
125
-
126
-
127
-
128
-
129
-
130
-
131
-
132
-
133
-
134
-
135
-
136
-
137
-
138
-
139
-
140
-
141
-
142
-
143
-
144
-
145
-
146
-
147
-
148
-
149
-
150
-
151
-
152
-
153
-
154
-
155
-
156
-
157
-
158
-
159
-
160
-
161
-
162
-
163
-
164
-
165
-
166
-
167
-
168
-
169
-
170
-
171
-
172
-
173
-
174
-
175
-
176
-
177
-
178
-
179
-
180
-
181
-
182
-
183
-
184
-
185
-
186
-
187
-
188
-
189
-
190
-
191
-
192
-
193
-
194
-
195
-
196
-
197
-
198
-
199
-
200
-
201
-
202
-
203
-
204
-
205
-
206
-
207
-
208
-
209
-
210
-
211
-
212
-
213
-
214
-
215
-
216
-
217
-
218
-
219
-
220
-
221
-
222
-
223
-
224
-
225
-
226
-
227
-
228
-
229
-
230
-
231
-
232
-
233
-
234
-
235
-
236
-
237
-
238
-
239
-
240
-
241
-
242
-
243
-
244
-
245
-
246
-
247
-
248
-
249
-
250
-
251
-
252
-
253
-
254
-
255
-
256
-
257
-
258
-
259
-
260
-
261
-
262
-
263
-
264
-
265
-
266
-
267
-
268
 |
 |
range of outcomes. Thus, the Company is required to exercise judgment regarding the application of these tax
laws and regulations. The Company will evaluate and recognize tax liabilities related to any tax uncertainties.
Due to the complexity of some of these uncertainties, the ultimate resolution may result in a payment that is
different from the current estimate of the tax liabilities.
The Company’s estimate of accrued income taxes, deferred income taxes and income tax expense can also
change in any period as a result of new legislative or judicial guidance impacting tax positions, as well as
changes in income tax rates. Any changes, if they occur, can be significant to the Company’s financial position,
results of operations or cash flows.
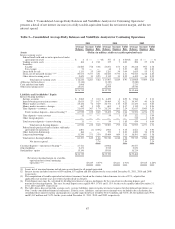
OPERATING RESULTS
GENERAL
For 2011, Regions reported a net loss available to common shareholders of $429 million, or $0.34 per
diluted common share. In January 2012, Regions entered into an agreement to sell Morgan Keegan to Raymond
James Financial, Inc. The results of the entities being sold are presented as discontinued operations. Refer to
Note 3 “Discontinued Operations” of the consolidated financial statements for additional information. Regions
reported a loss from continuing operations available to common shareholders of $25 million, or $0.02 per diluted
common share in 2011. Regions’ net loss from discontinued operations was $404 million, or $0.32 per diluted
common share.
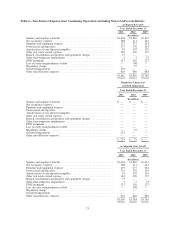
Regions’ 2011 results were impacted by a $731 million (net of $14 million income tax impact) non-cash
goodwill impairment charge related to Regions’ Investment Banking/Brokerage/Trust reporting segment. Based
on a relative fair value allocation, $253 million of the impairment charges was recorded within continuing
operations and $478 million was recorded within discontinued operations.
Regions’ 2011 results also included a $44 million income tax benefit related to a regulatory settlement, of
which approximately $17 million was associated with continuing operations and $27 million with discontinued
operations. Excluding these two items, Regions’ income from continuing operations available to common
shareholders was $211 million, or $0.17 per diluted common share in 2011. See Table 2 “GAAP to non-GAAP
Reconciliation”. Regions’ results reflected higher net interest income, lower non-interest expenses and a
significant decline in its provision for loan losses. These items were partially offset by lower non-interest income.
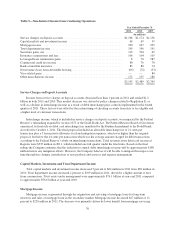
NET INTEREST INCOME AND MARGIN
Net interest income (interest income less interest expense) is Regions’ principal source of income and is one
of the most important elements of Regions’ ability to meet its overall performance goals. Net interest income on
a fully taxable-equivalent basis increased approximately $24 million, or 1 percent in 2011, from 2010 despite a 5
percent decrease in the level of average earning assets, from $117.5 billion in 2010 to $112.2 billion in 2011. The
increase in net interest income was sufficient to offset the impact of the smaller balance sheet, and resulted in the
net interest margin increasing to 3.07 percent in 2011 from 2.91 percent in 2010.
Comparing 2011 to 2010, interest-earning asset yields were lower, decreasing 15 basis points on average.
However, interest-bearing liability rates were also lower, declining by 34 basis points, more than offsetting the
drop in interest-earning asset yields. As a result, the net interest rate spread increased 19 basis points to 2.78
percent in 2011 compared to 2.59 percent in 2010.
Continued low levels of long-term interest rates affected interest-earning asset yields through their influence
on the behavior and pricing of both variable-rate and fixed-rate loans and securities. Longer-term rates were
impacted by Federal Reserve actions which in effect lowered long-term interest rates. The yield on the
benchmark 10-year U.S. Treasury note ranged from a high of 3.74 percent to a low of 1.72 percent, and for the
year decreased 142 basis points, ending the year at 1.88 percent. Persistently low long-term rates can incent
65