Regions Bank 2011 Annual Report Download - page 106
Download and view the complete annual report
Please find page 106 of the 2011 Regions Bank annual report below. You can navigate through the pages in the report by either clicking on the pages listed below, or by using the keyword search tool below to find specific information within the annual report.-
 1
1 -
2
-
3
-
4
-
5
-
6
-
7
-
8
-
9
-
10
-
11
-
12
-
13
-
14
-
15
-
16
-
17
-
18
-
19
-
20
-
21
-
22
-
23
-
24
-
25
-
26
-
27
-
28
-
29
-
30
-
31
-
32
-
33
-
34
-
35
-
36
-
37
-
38
-
39
-
40
-
41
-
42
-
43
-
44
-
45
-
46
-
47
-
48
-
49
-
50
-
51
-
52
-
53
-
54
-
55
-
56
-
57
-
58
-
59
-
60
-
61
-
62
-
63
-
64
-
65
-
66
-
67
-
68
-
69
-
70
-
71
-
72
-
73
-
74
-
75
-
76
-
77
-
78
-
79
-
80
-
81
-
82
-
83
-
84
-
85
-
86
-
87
-
88
-
89
-
90
-
91
-
92
-
93
-
94
-
95
-
 96
96 -
 97
97 -
 98
98 -
 99
99 -
 100
100 -
 101
101 -
 102
102 -
 103
103 -
 104
104 -
 105
105 -
 106
106 -
 107
107 -
 108
108 -
 109
109 -
 110
110 -
 111
111 -
 112
112 -
 113
113 -
 114
114 -
 115
115 -
 116
116 -
117
-
118
-
119
-
120
-
121
-
122
-
123
-
124
-
125
-
126
-
127
-
128
-
129
-
130
-
131
-
132
-
133
-
134
-
135
-
136
-
137
-
138
-
139
-
140
-
141
-
142
-
143
-
144
-
145
-
146
-
147
-
148
-
149
-
150
-
151
-
152
-
153
-
154
-
155
-
156
-
157
-
158
-
159
-
160
-
161
-
162
-
163
-
164
-
165
-
166
-
167
-
168
-
169
-
170
-
171
-
172
-
173
-
174
-
175
-
176
-
177
-
178
-
179
-
180
-
181
-
182
-
183
-
184
-
185
-
186
-
187
-
188
-
189
-
190
-
191
-
192
-
193
-
194
-
195
-
196
-
197
-
198
-
199
-
200
-
201
-
202
-
203
-
204
-
205
-
206
-
207
-
208
-
209
-
210
-
211
-
212
-
213
-
214
-
215
-
216
-
217
-
218
-
219
-
220
-
221
-
222
-
223
-
224
-
225
-
226
-
227
-
228
-
229
-
230
-
231
-
232
-
233
-
234
-
235
-
236
-
237
-
238
-
239
-
240
-
241
-
242
-
243
-
244
-
245
-
246
-
247
-
248
-
249
-
250
-
251
-
252
-
253
-
254
-
255
-
256
-
257
-
258
-
259
-
260
-
261
-
262
-
263
-
264
-
265
-
266
-
267
-
268
 |
 |

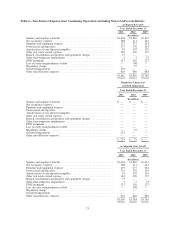
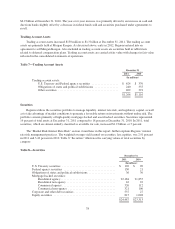
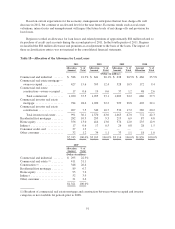
Table 11—Selected Loan Maturities
Loans Maturing as of December 31, 2011 (2)
Within
One Year
After One
But Within
Five Years
After
Five
Years Total
(In millions)
Commercial and industrial (1) ................................. $ 5,511 $14,613 $4,269 $24,393
Commercial real estate mortgage—owner-occupied ............... 1,965 5,913 3,288 11,166
Commercial real estate construction—owner-occupied ............. 39 126 172 337
Total commercial ...................................... 7,515 20,652 7,729 35,896
Commercial investor real estate mortgage ....................... 4,811 4,253 638 9,702
Commercial investor real estate construction ..................... 605 396 24 1,025
Total investor real estate ................................. 5,416 4,649 662 10,727
$12,931 $25,301 $8,391 $46,623
Predetermined
Rate
Variable
Rate
(In millions)
Due after one year but within five years ...................................... $5,894 $19,407
Due after five years ...................................................... 4,087 4,304
$9,981 $23,711
(1) Excludes $129 million of small business credit card accounts.
(2) Table 11 excludes residential first mortgage, home equity, indirect and other consumer loans.
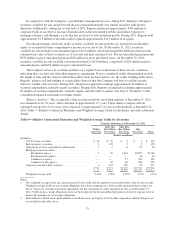
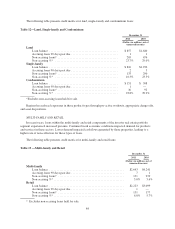
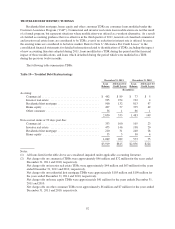
The following sections describe the composition of the portfolio segments and classes in Table 10 and
explain variations in balances from the 2010 year-end. See Note 5 “Loans” and Note 6 “Allowance for Credit
Losses” to the consolidated financial statements for additional discussion.
Commercial—The commercial portfolio segment includes commercial and industrial loans to commercial
customers for use in normal business operations to finance working capital needs, equipment purchases and other
expansion projects. Commercial also includes owner-occupied commercial real estate loans to operating
businesses, which are loans for long-term financing of land and buildings, and are repaid by cash flow generated
by business operations. Owner-occupied construction loans are made to commercial businesses for the
development of land or construction of a building where the repayment is derived from revenues generated from
the business of the borrower. During 2011, total commercial loan balances increased $969 million, or 3 percent,
driven by growth experienced in specialized industry groups.
Investor Real Estate—Loans for real estate development are repaid through cash flow related to the
operation, sale or refinance of the property. This portfolio segment includes extensions of credit to real estate
developers or investors where repayment is dependent on the sale of real estate or income generated from the real
estate collateral. A portion of Regions’ investor real estate portfolio segment is comprised of loans secured by
residential product types (land, single-family and condominium loans) within Regions’ markets. Additionally,
this category includes loans made to finance income-producing properties such as apartment buildings, office and
industrial buildings, and retail shopping centers. The investor real estate loan segment decreased $5.2 billion
from 2010 balances primarily due to strategic decisions to reduce the concentration in investor real estate in
response to credit risk and economic pressure.
Residential First Mortgage—Residential first mortgage loans represent loans to consumers to finance a
residence. These loans are typically financed over a 15 to 30 year term and, in most cases, are extended to
borrowers to finance their primary residence. These loans experienced a $1.1 billion decline to $13.8 billion in
82