Regions Bank 2011 Annual Report Download - page 198
Download and view the complete annual report
Please find page 198 of the 2011 Regions Bank annual report below. You can navigate through the pages in the report by either clicking on the pages listed below, or by using the keyword search tool below to find specific information within the annual report.-
 1
1 -
2
-
3
-
4
-
5
-
6
-
7
-
8
-
9
-
10
-
11
-
12
-
13
-
14
-
15
-
16
-
17
-
18
-
19
-
20
-
21
-
22
-
23
-
24
-
25
-
26
-
27
-
28
-
29
-
30
-
31
-
32
-
33
-
34
-
35
-
36
-
37
-
38
-
39
-
40
-
41
-
42
-
43
-
44
-
45
-
46
-
47
-
48
-
49
-
50
-
51
-
52
-
53
-
54
-
55
-
56
-
57
-
58
-
59
-
60
-
61
-
62
-
63
-
64
-
65
-
66
-
67
-
68
-
69
-
70
-
71
-
72
-
73
-
74
-
75
-
76
-
77
-
78
-
79
-
80
-
81
-
82
-
83
-
84
-
85
-
86
-
87
-
88
-
89
-
90
-
91
-
92
-
93
-
94
-
95
-
96
-
97
-
98
-
99
-
100
-
101
-
102
-
103
-
104
-
105
-
106
-
107
-
108
-
109
-
110
-
111
-
112
-
113
-
114
-
115
-
116
-
117
-
118
-
119
-
120
-
121
-
122
-
123
-
124
-
125
-
126
-
127
-
128
-
129
-
130
-
131
-
132
-
133
-
134
-
135
-
136
-
137
-
138
-
139
-
140
-
141
-
142
-
143
-
144
-
145
-
146
-
147
-
148
-
149
-
150
-
151
-
152
-
153
-
154
-
155
-
156
-
157
-
158
-
159
-
160
-
161
-
162
-
163
-
164
-
165
-
166
-
167
-
168
-
169
-
170
-
171
-
172
-
173
-
174
-
175
-
176
-
177
-
178
-
179
-
180
-
181
-
182
-
183
-
184
-
185
-
186
-
187
-
 188
188 -
 189
189 -
 190
190 -
 191
191 -
 192
192 -
 193
193 -
 194
194 -
 195
195 -
 196
196 -
 197
197 -
 198
198 -
 199
199 -
 200
200 -
 201
201 -
 202
202 -
 203
203 -
 204
204 -
 205
205 -
 206
206 -
 207
207 -
 208
208 -
209
-
210
-
211
-
212
-
213
-
214
-
215
-
216
-
217
-
218
-
219
-
220
-
221
-
222
-
223
-
224
-
225
-
226
-
227
-
228
-
229
-
230
-
231
-
232
-
233
-
234
-
235
-
236
-
237
-
238
-
239
-
240
-
241
-
242
-
243
-
244
-
245
-
246
-
247
-
248
-
249
-
250
-
251
-
252
-
253
-
254
-
255
-
256
-
257
-
258
-
259
-
260
-
261
-
262
-
263
-
264
-
265
-
266
-
267
-
268
 |
 |

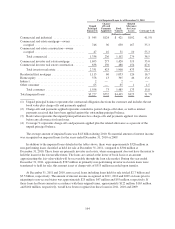
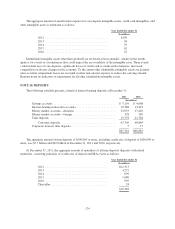
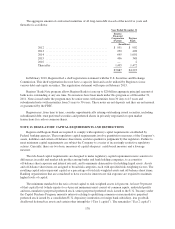
The aggregate amount of amortization expense for core deposit intangible assets, credit card intangibles, and
other intangible assets is estimated as follows:
Year Ended December 31
(In millions)
2012 .......................................... $109
2013 .......................................... 94
2014 .......................................... 79
2015 .......................................... 62
2016 .......................................... 22
Identifiable intangible assets other than goodwill are reviewed at least annually, usually in the fourth
quarter, for events or circumstances that could impact the recoverability of the intangible asset. These events
could include loss of core deposits, significant losses of credit card accounts and/or balances, increased
competition or adverse changes in the economy. To the extent other identifiable intangible assets are deemed
unrecoverable, impairment losses are recorded in other non-interest expense to reduce the carrying amount.
Regions noted no indicators of impairment for all other identifiable intangible assets.
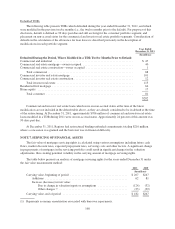
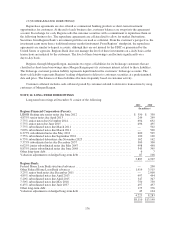
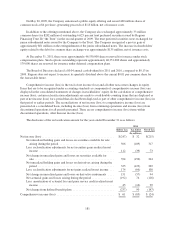
NOTE 10. DEPOSITS
The following schedule presents a detail of interest-bearing deposits at December 31:
2011 2010
(In millions)
Savings accounts .......................................... $ 5,159 $ 4,668
Interest-bearing transaction accounts .......................... 19,388 13,423
Money market accounts—domestic ........................... 23,053 27,420
Money market accounts—foreign ............................. 378 569
Time deposits ............................................ 19,378 22,784
Customer deposits ..................................... 67,356 68,864
Corporate treasury time deposits .............................. 5 17
$67,361 $68,881
The aggregate amount of time deposits of $100,000 or more, including certificates of deposit of $100,000 or
more, was $7.7 billion and $8.9 billion at December 31, 2011 and 2010, respectively.
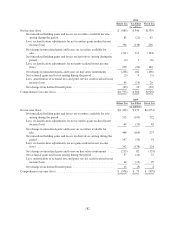
At December 31, 2011, the aggregate amount of maturities of all time deposits (deposits with stated
maturities, consisting primarily of certificates of deposit and IRAs) were as follows:
Year Ended December 31
(In millions)
2012 .......................................... $12,313
2013 .......................................... 4,272
2014 .......................................... 699
2015 .......................................... 1,080
2016 .......................................... 995
Thereafter ...................................... 24
$19,383
174