Regions Bank 2011 Annual Report Download - page 22
Download and view the complete annual report
Please find page 22 of the 2011 Regions Bank annual report below. You can navigate through the pages in the report by either clicking on the pages listed below, or by using the keyword search tool below to find specific information within the annual report.-
 1
1 -
2
-
3
-
4
-
5
-
6
-
7
-
8
-
9
-
10
-
11
-
 12
12 -
 13
13 -
 14
14 -
 15
15 -
 16
16 -
 17
17 -
 18
18 -
 19
19 -
 20
20 -
 21
21 -
 22
22 -
 23
23 -
 24
24 -
 25
25 -
 26
26 -
 27
27 -
 28
28 -
 29
29 -
 30
30 -
 31
31 -
 32
32 -
33
-
34
-
35
-
36
-
37
-
38
-
39
-
40
-
41
-
42
-
43
-
44
-
45
-
46
-
47
-
48
-
49
-
50
-
51
-
52
-
53
-
54
-
55
-
56
-
57
-
58
-
59
-
60
-
61
-
62
-
63
-
64
-
65
-
66
-
67
-
68
-
69
-
70
-
71
-
72
-
73
-
74
-
75
-
76
-
77
-
78
-
79
-
80
-
81
-
82
-
83
-
84
-
85
-
86
-
87
-
88
-
89
-
90
-
91
-
92
-
93
-
94
-
95
-
96
-
97
-
98
-
99
-
100
-
101
-
102
-
103
-
104
-
105
-
106
-
107
-
108
-
109
-
110
-
111
-
112
-
113
-
114
-
115
-
116
-
117
-
118
-
119
-
120
-
121
-
122
-
123
-
124
-
125
-
126
-
127
-
128
-
129
-
130
-
131
-
132
-
133
-
134
-
135
-
136
-
137
-
138
-
139
-
140
-
141
-
142
-
143
-
144
-
145
-
146
-
147
-
148
-
149
-
150
-
151
-
152
-
153
-
154
-
155
-
156
-
157
-
158
-
159
-
160
-
161
-
162
-
163
-
164
-
165
-
166
-
167
-
168
-
169
-
170
-
171
-
172
-
173
-
174
-
175
-
176
-
177
-
178
-
179
-
180
-
181
-
182
-
183
-
184
-
185
-
186
-
187
-
188
-
189
-
190
-
191
-
192
-
193
-
194
-
195
-
196
-
197
-
198
-
199
-
200
-
201
-
202
-
203
-
204
-
205
-
206
-
207
-
208
-
209
-
210
-
211
-
212
-
213
-
214
-
215
-
216
-
217
-
218
-
219
-
220
-
221
-
222
-
223
-
224
-
225
-
226
-
227
-
228
-
229
-
230
-
231
-
232
-
233
-
234
-
235
-
236
-
237
-
238
-
239
-
240
-
241
-
242
-
243
-
244
-
245
-
246
-
247
-
248
-
249
-
250
-
251
-
252
-
253
-
254
-
255
-
256
-
257
-
258
-
259
-
260
-
261
-
262
-
263
-
264
-
265
-
266
-
267
-
268
 |
 |

(In millions, except per share data) 2011 2010 2009
EARNINGS SUMMARY
Income (loss) from continuing operations available to common shareholders $ (25) $ (692) $ (1,304)
Net income (loss) available to common shareholders $ (429) $ (763) $ (1,261)
Earnings (loss) per common share from continuing operations – diluted $ (0.02) $ (0.56) $ (1.32)
Earnings (loss) per common share – diluted $ (0.34) $ (0.62) $ (1.27)
BALANCE SHEET SUMMARY
At year-end
Loans net of unearned income $ 77,594 $ 82,864 $ 90,674
Assets 127,050 132,351 142,318
Deposits 95,627 94,614 98,680
Long-term debt 8,110 13,190 18,464
Stockholders’ equity 16,499 16,734 17,881
Average balances – Continuing Operations
Loans net of unearned income $ 80,673 $ 86,660 $ 94,523
Assets 126,719 132,720 139,468
Deposits 95,671 96,489 94,612
Long-term debt 11,240 15,489 18,501
Stockholders’ equity 15,350 15,916 16,224
SELECTED RATIOS
Tangible common stockholders’ equity to tangible assets (non-GAAP)1 6.58% 6.04% 6.22%
Allowance for loan losses as a percentage of loans net of unearned income 3.54 3.84 3.43
Allowance for credit losses as a percentage of loans net of unearned income 3.64 3.93 3.52
Effi ciency ratio (non-GAAP)1 64.56 67.74 67.88
Tier 1 common (non-GAAP)1 8.51 7.85 7.15
Tier 1 capital 13.28 12.40 11.54
OTHER INFORMATION
Basic Weighted-average number of common shares outstanding 1,258 1,227 989
Diluted Weighted-average number of common shares outstanding 1,258 1,227 989
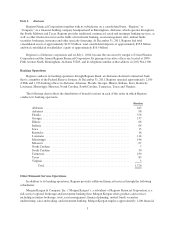
Total Branch Outlets 1,726 1,772 1,895
ATMs 2,083 2,148 2,304
1See Table 2 in Form 10-K for GAAP to non-GAAP reconciliations.