Regions Bank 2011 Annual Report Download - page 209
Download and view the complete annual report
Please find page 209 of the 2011 Regions Bank annual report below. You can navigate through the pages in the report by either clicking on the pages listed below, or by using the keyword search tool below to find specific information within the annual report.-
 1
1 -
2
-
3
-
4
-
5
-
6
-
7
-
8
-
9
-
10
-
11
-
12
-
13
-
14
-
15
-
16
-
17
-
18
-
19
-
20
-
21
-
22
-
23
-
24
-
25
-
26
-
27
-
28
-
29
-
30
-
31
-
32
-
33
-
34
-
35
-
36
-
37
-
38
-
39
-
40
-
41
-
42
-
43
-
44
-
45
-
46
-
47
-
48
-
49
-
50
-
51
-
52
-
53
-
54
-
55
-
56
-
57
-
58
-
59
-
60
-
61
-
62
-
63
-
64
-
65
-
66
-
67
-
68
-
69
-
70
-
71
-
72
-
73
-
74
-
75
-
76
-
77
-
78
-
79
-
80
-
81
-
82
-
83
-
84
-
85
-
86
-
87
-
88
-
89
-
90
-
91
-
92
-
93
-
94
-
95
-
96
-
97
-
98
-
99
-
100
-
101
-
102
-
103
-
104
-
105
-
106
-
107
-
108
-
109
-
110
-
111
-
112
-
113
-
114
-
115
-
116
-
117
-
118
-
119
-
120
-
121
-
122
-
123
-
124
-
125
-
126
-
127
-
128
-
129
-
130
-
131
-
132
-
133
-
134
-
135
-
136
-
137
-
138
-
139
-
140
-
141
-
142
-
143
-
144
-
145
-
146
-
147
-
148
-
149
-
150
-
151
-
152
-
153
-
154
-
155
-
156
-
157
-
158
-
159
-
160
-
161
-
162
-
163
-
164
-
165
-
166
-
167
-
168
-
169
-
170
-
171
-
172
-
173
-
174
-
175
-
176
-
177
-
178
-
179
-
180
-
181
-
182
-
183
-
184
-
185
-
186
-
187
-
188
-
189
-
190
-
191
-
192
-
193
-
194
-
195
-
196
-
197
-
198
-
 199
199 -
 200
200 -
 201
201 -
 202
202 -
 203
203 -
 204
204 -
 205
205 -
 206
206 -
 207
207 -
 208
208 -
 209
209 -
 210
210 -
 211
211 -
 212
212 -
 213
213 -
 214
214 -
 215
215 -
 216
216 -
 217
217 -
 218
218 -
 219
219 -
220
-
221
-
222
-
223
-
224
-
225
-
226
-
227
-
228
-
229
-
230
-
231
-
232
-
233
-
234
-
235
-
236
-
237
-
238
-
239
-
240
-
241
-
242
-
243
-
244
-
245
-
246
-
247
-
248
-
249
-
250
-
251
-
252
-
253
-
254
-
255
-
256
-
257
-
258
-
259
-
260
-
261
-
262
-
263
-
264
-
265
-
266
-
267
-
268
 |
 |

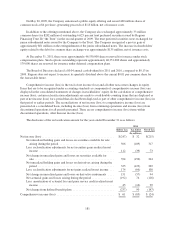
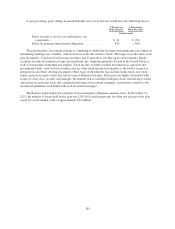
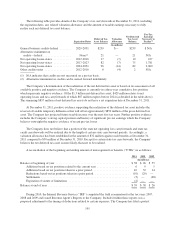
The following table summarizes the weighted-average assumptions used and the weighted-average
estimated fair values related to stock options granted during the years ended December 31:
2011 2010 2009
Expected option life ............................................ 5.8yrs. 5.8 yrs. 6.8 yrs.
Expected volatility ............................................. 75.5% 74.0% 67.2%
Expected dividend yield ......................................... 2.3% 2.2% 1.8%
Risk-free interest rate ........................................... 2.0% 2.2% 2.8%
Fair value .................................................... $3.66 $3.86 $1.79
Refer to Note 1 for a discussion of the methodologies used to derive the underlying assumptions used in the
Black-Scholes option pricing model. The stock option awards granted during 2011 and 2010 were granted to a
broader pool of employees than the 2009 awards. The expected exercise behavior of the broader base of
employees receiving awards resulted in a lower expected option life when comparing 2011 and 2010 to 2009.
The expected volatility increased in 2011 and 2010 based upon increases in the historical volatility of Regions’
stock price, offset slightly by reductions in the implied volatility measurements from traded options on the
Company’s stock, when comparing 2011 and 2010 to 2009.
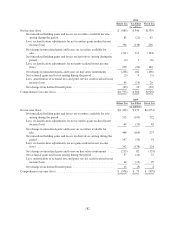
The following table summarizes the activity for 2011, 2010 and 2009 related to stock options:
Number of
Options
Weighted-
Average
Exercise
Price
Aggregate
Intrinsic Value
(In Millions)
Weighted-
Average
Remaining
Contractual
Term
Outstanding at December 31, 2008 ................... 52,955,298 $28.22 $— 5.53 yrs.
Granted ......................................... 4,083,209 3.30
Exercised ........................................ — —
Canceled/Forfeited ................................ (4,069,947) 27.84
Outstanding at December 31, 2009 ................... 52,968,560 $26.34 $ 8 5.04 yrs.
Granted ......................................... 7,173,667 7.00
Exercised ........................................ (137,736) 3.29
Canceled/Forfeited ................................ (5,004,865) 20.66
Outstanding at December 31, 2010 ................... 54,999,626 $24.41 $ 11 4.76 yrs.
Granted ......................................... 1,451,200 6.59
Exercised ........................................ (18,442) 3.29
Canceled/Forfeited ................................ (10,081,035) 25.30
Outstanding at December 31, 2011 ................... 46,351,349 $23.62 $ 3 4.55 yrs.
Exercisable at December 31, 2011 .................... 40,003,591 $26.33 $ 2 3.91 yrs.
For the years ended December 31, 2011, 2010 and 2009, the total intrinsic value of options exercised was
immaterial for all years.
RESTRICTED STOCK AWARDS
During 2011 and 2010, Regions made restricted share grants that vest based upon a service condition.
Dividend payments during the vesting period are deferred to the end of the vesting term. The fair value of these
restricted shares was estimated based upon the fair value of the underlying shares on the date of the grant. The
valuation was not adjusted for the deferral of dividends.
During 2009, Regions granted 3 million restricted shares that vest based upon a service condition and a
market condition in addition to awards that were similar to prior grants. The fair value of these restricted shares
185