Regions Bank 2011 Annual Report Download - page 79
Download and view the complete annual report
Please find page 79 of the 2011 Regions Bank annual report below. You can navigate through the pages in the report by either clicking on the pages listed below, or by using the keyword search tool below to find specific information within the annual report.-
 1
1 -
2
-
3
-
4
-
5
-
6
-
7
-
8
-
9
-
10
-
11
-
12
-
13
-
14
-
15
-
16
-
17
-
18
-
19
-
20
-
21
-
22
-
23
-
24
-
25
-
26
-
27
-
28
-
29
-
30
-
31
-
32
-
33
-
34
-
35
-
36
-
37
-
38
-
39
-
40
-
41
-
42
-
43
-
44
-
45
-
46
-
47
-
48
-
49
-
50
-
51
-
52
-
53
-
54
-
55
-
56
-
57
-
58
-
59
-
60
-
61
-
62
-
63
-
64
-
65
-
66
-
67
-
68
-
 69
69 -
 70
70 -
 71
71 -
 72
72 -
 73
73 -
 74
74 -
 75
75 -
 76
76 -
 77
77 -
 78
78 -
 79
79 -
 80
80 -
 81
81 -
 82
82 -
 83
83 -
 84
84 -
 85
85 -
 86
86 -
 87
87 -
 88
88 -
 89
89 -
90
-
91
-
92
-
93
-
94
-
95
-
96
-
97
-
98
-
99
-
100
-
101
-
102
-
103
-
104
-
105
-
106
-
107
-
108
-
109
-
110
-
111
-
112
-
113
-
114
-
115
-
116
-
117
-
118
-
119
-
120
-
121
-
122
-
123
-
124
-
125
-
126
-
127
-
128
-
129
-
130
-
131
-
132
-
133
-
134
-
135
-
136
-
137
-
138
-
139
-
140
-
141
-
142
-
143
-
144
-
145
-
146
-
147
-
148
-
149
-
150
-
151
-
152
-
153
-
154
-
155
-
156
-
157
-
158
-
159
-
160
-
161
-
162
-
163
-
164
-
165
-
166
-
167
-
168
-
169
-
170
-
171
-
172
-
173
-
174
-
175
-
176
-
177
-
178
-
179
-
180
-
181
-
182
-
183
-
184
-
185
-
186
-
187
-
188
-
189
-
190
-
191
-
192
-
193
-
194
-
195
-
196
-
197
-
198
-
199
-
200
-
201
-
202
-
203
-
204
-
205
-
206
-
207
-
208
-
209
-
210
-
211
-
212
-
213
-
214
-
215
-
216
-
217
-
218
-
219
-
220
-
221
-
222
-
223
-
224
-
225
-
226
-
227
-
228
-
229
-
230
-
231
-
232
-
233
-
234
-
235
-
236
-
237
-
238
-
239
-
240
-
241
-
242
-
243
-
244
-
245
-
246
-
247
-
248
-
249
-
250
-
251
-
252
-
253
-
254
-
255
-
256
-
257
-
258
-
259
-
260
-
261
-
262
-
263
-
264
-
265
-
266
-
267
-
268
 |
 |
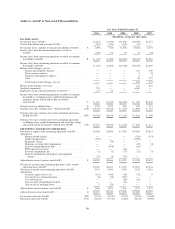
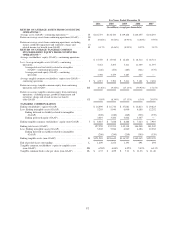
Non-GAAP financial measures have inherent limitations, are not required to be uniformly applied and are
not audited. Although these non-GAAP financial measures are frequently used by stakeholders in the evaluation
of a company, they have limitations as analytical tools, and should not be considered in isolation, or as a
substitute for analyses of results as reported under GAAP. In particular, a measure of earnings that excludes the
merger, goodwill impairment and regulatory charge and related income tax benefit does not represent the amount
that effectively accrues directly to stockholders (i.e., the merger, goodwill impairment and regulatory charge are
a reduction to earnings and stockholders’ equity).
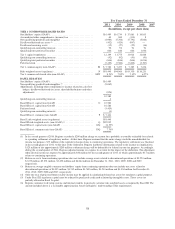
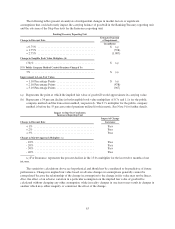
The following tables provide: 1) a reconciliation of net income (loss) available to common shareholders
(GAAP) to income (loss) from continuing operations available to common shareholders, 2) income (loss) from
continuing operations available to common shareholders to income (loss) from continuing operations available to
common shareholders, excluding merger, goodwill impairment and regulatory charge and related income tax
benefit (non-GAAP), 3) a reconciliation of earnings (loss) per common share from continuing operations
(GAAP) to earnings (loss) per common share from continuing operations, excluding merger, goodwill
impairment and regulatory charge and related income tax benefit (non-GAAP), 4) a reconciliation of non-interest
expense from continuing operations (GAAP) to adjusted non-interest expense (non-GAAP), 5) a reconciliation of
non-interest income from continuing operations (GAAP) to adjusted non-interest income (non-GAAP), 6) a
computation of adjusted total revenue (non-GAAP), 7), a computation of the fee income ratio (non-GAAP), 8) a
computation of the efficiency ratio (non-GAAP), 9) a computation of return on average assets from continuing
operations, excluding merger, goodwill impairment and regulatory charge and related income tax benefit (non-
GAAP), 10) a reconciliation of average and ending stockholders’ equity (GAAP) to average and ending tangible
common stockholders’ equity (non-GAAP) and calculations of related ratios, excluding discontinued operations,
merger, goodwill impairment and regulatory charge and related income tax benefit (non-GAAP), 11) a
reconciliation of stockholders’ equity (GAAP) to Tier 1 capital (regulatory) and to Tier 1 common equity (non-
GAAP) and calculations of related ratios, and 12) a reconciliation of stockholders’ equity (GAAP) to Basel III
Tier 1 capital (non-GAAP), Basel III total capital (non-GAAP) and Basel III Tier 1 common (non-GAAP) and
calculations of related ratios.
55