Regions Bank 2011 Annual Report Download - page 236
Download and view the complete annual report
Please find page 236 of the 2011 Regions Bank annual report below. You can navigate through the pages in the report by either clicking on the pages listed below, or by using the keyword search tool below to find specific information within the annual report.-
 1
1 -
2
-
3
-
4
-
5
-
6
-
7
-
8
-
9
-
10
-
11
-
12
-
13
-
14
-
15
-
16
-
17
-
18
-
19
-
20
-
21
-
22
-
23
-
24
-
25
-
26
-
27
-
28
-
29
-
30
-
31
-
32
-
33
-
34
-
35
-
36
-
37
-
38
-
39
-
40
-
41
-
42
-
43
-
44
-
45
-
46
-
47
-
48
-
49
-
50
-
51
-
52
-
53
-
54
-
55
-
56
-
57
-
58
-
59
-
60
-
61
-
62
-
63
-
64
-
65
-
66
-
67
-
68
-
69
-
70
-
71
-
72
-
73
-
74
-
75
-
76
-
77
-
78
-
79
-
80
-
81
-
82
-
83
-
84
-
85
-
86
-
87
-
88
-
89
-
90
-
91
-
92
-
93
-
94
-
95
-
96
-
97
-
98
-
99
-
100
-
101
-
102
-
103
-
104
-
105
-
106
-
107
-
108
-
109
-
110
-
111
-
112
-
113
-
114
-
115
-
116
-
117
-
118
-
119
-
120
-
121
-
122
-
123
-
124
-
125
-
126
-
127
-
128
-
129
-
130
-
131
-
132
-
133
-
134
-
135
-
136
-
137
-
138
-
139
-
140
-
141
-
142
-
143
-
144
-
145
-
146
-
147
-
148
-
149
-
150
-
151
-
152
-
153
-
154
-
155
-
156
-
157
-
158
-
159
-
160
-
161
-
162
-
163
-
164
-
165
-
166
-
167
-
168
-
169
-
170
-
171
-
172
-
173
-
174
-
175
-
176
-
177
-
178
-
179
-
180
-
181
-
182
-
183
-
184
-
185
-
186
-
187
-
188
-
189
-
190
-
191
-
192
-
193
-
194
-
195
-
196
-
197
-
198
-
199
-
200
-
201
-
202
-
203
-
204
-
205
-
206
-
207
-
208
-
209
-
210
-
211
-
212
-
213
-
214
-
215
-
216
-
217
-
218
-
219
-
220
-
221
-
222
-
223
-
224
-
225
-
 226
226 -
 227
227 -
 228
228 -
 229
229 -
 230
230 -
 231
231 -
 232
232 -
 233
233 -
 234
234 -
 235
235 -
 236
236 -
 237
237 -
 238
238 -
 239
239 -
 240
240 -
 241
241 -
 242
242 -
 243
243 -
 244
244 -
 245
245 -
 246
246 -
247
-
248
-
249
-
250
-
251
-
252
-
253
-
254
-
255
-
256
-
257
-
258
-
259
-
260
-
261
-
262
-
263
-
264
-
265
-
266
-
267
-
268
 |
 |

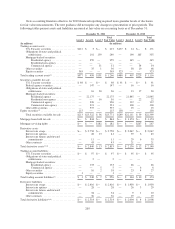
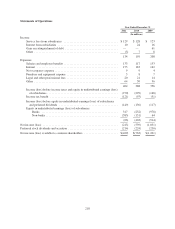
The following tables present financial information for each reportable segment for the years ended
December 31:
Year Ended December 31, 2011
Investment Banking/
Brokerage/Trust
Banking/
Treasury Insurance
Continuing
Operations
Discontinued
Operations
Total
Company
(In millions)
Net interest income .......................... $ 3,375 $ 2 $ 33 $ 31 $ 3,441
Provision for loan losses ...................... 1,530 — — — 1,530
Non-interest income .......................... 1,800 136 207 995 3,138
Non-interest expense ......................... 3,342 99 168 942 4,551
Goodwill impairment ......................... — — 253 492 745
Income tax expense (benefit) ................... (52) 14 10 (4) (32)
Net income ................................. $ 355 $ 25 $ (191) $ (404) $ (215)
Average assets .............................. $122,497 $527 $3,695 $3,254 $129,973
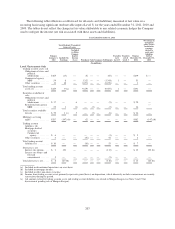
Year Ended December 31, 2010
Investment Banking/
Brokerage/Trust
Banking/
Treasury Insurance
Continuing
Operations
Discontinued
Operations
Total
Company
(In millions)
Net interest income .......................... $ 3,364 $ 2 $ 23 $ 43 $ 3,432
Provision for loan losses ...................... 2,863 — — — 2,863
Non-interest income .......................... 2,152 137 200 1,042 3,531
Non-interest expense ......................... 3,532 95 157 1,001 4,785
Regulatory charge ........................... — — 75 125 200
Income tax expense (benefit) ................... (427) 15 36 30 (346)
Net income (loss) ............................ $ (452) $ 29 $ (45) $ (71) $ (539)
Average assets .............................. $129,618 $513 $2,589 $3,235 $135,955
Year Ended December 31, 2009
Investment Banking/
Brokerage/Trust
Banking/
Treasury Insurance
Continuing
Operations
Discontinued
Operations
Total
Company
(In millions)
Net interest income .......................... $ 3,273 $ 3 $ 17 $ 42 $ 3,335
Provision for loan losses ...................... 3,541 — — — 3,541
Non-interest income .......................... 2,410 139 216 990 3,755
Non-interest expense ......................... 3,533 96 156 966 4,751
Income tax expense (benefit) ................... (241) 18 29 23 (171)
Net income (loss) ............................ $ (1,150) $ 28 $ 48 $ 43 $ (1,031)
Average assets .............................. $137,664 $494 $1,310 $3,291 $142,759
212