Regions Bank 2011 Annual Report Download - page 73
Download and view the complete annual report
Please find page 73 of the 2011 Regions Bank annual report below. You can navigate through the pages in the report by either clicking on the pages listed below, or by using the keyword search tool below to find specific information within the annual report.-
 1
1 -
2
-
3
-
4
-
5
-
6
-
7
-
8
-
9
-
10
-
11
-
12
-
13
-
14
-
15
-
16
-
17
-
18
-
19
-
20
-
21
-
22
-
23
-
24
-
25
-
26
-
27
-
28
-
29
-
30
-
31
-
32
-
33
-
34
-
35
-
36
-
37
-
38
-
39
-
40
-
41
-
42
-
43
-
44
-
45
-
46
-
47
-
48
-
49
-
50
-
51
-
52
-
53
-
54
-
55
-
56
-
57
-
58
-
59
-
60
-
61
-
62
-
 63
63 -
 64
64 -
 65
65 -
 66
66 -
 67
67 -
 68
68 -
 69
69 -
 70
70 -
 71
71 -
 72
72 -
 73
73 -
 74
74 -
 75
75 -
 76
76 -
 77
77 -
 78
78 -
 79
79 -
 80
80 -
 81
81 -
 82
82 -
 83
83 -
84
-
85
-
86
-
87
-
88
-
89
-
90
-
91
-
92
-
93
-
94
-
95
-
96
-
97
-
98
-
99
-
100
-
101
-
102
-
103
-
104
-
105
-
106
-
107
-
108
-
109
-
110
-
111
-
112
-
113
-
114
-
115
-
116
-
117
-
118
-
119
-
120
-
121
-
122
-
123
-
124
-
125
-
126
-
127
-
128
-
129
-
130
-
131
-
132
-
133
-
134
-
135
-
136
-
137
-
138
-
139
-
140
-
141
-
142
-
143
-
144
-
145
-
146
-
147
-
148
-
149
-
150
-
151
-
152
-
153
-
154
-
155
-
156
-
157
-
158
-
159
-
160
-
161
-
162
-
163
-
164
-
165
-
166
-
167
-
168
-
169
-
170
-
171
-
172
-
173
-
174
-
175
-
176
-
177
-
178
-
179
-
180
-
181
-
182
-
183
-
184
-
185
-
186
-
187
-
188
-
189
-
190
-
191
-
192
-
193
-
194
-
195
-
196
-
197
-
198
-
199
-
200
-
201
-
202
-
203
-
204
-
205
-
206
-
207
-
208
-
209
-
210
-
211
-
212
-
213
-
214
-
215
-
216
-
217
-
218
-
219
-
220
-
221
-
222
-
223
-
224
-
225
-
226
-
227
-
228
-
229
-
230
-
231
-
232
-
233
-
234
-
235
-
236
-
237
-
238
-
239
-
240
-
241
-
242
-
243
-
244
-
245
-
246
-
247
-
248
-
249
-
250
-
251
-
252
-
253
-
254
-
255
-
256
-
257
-
258
-
259
-
260
-
261
-
262
-
263
-
264
-
265
-
266
-
267
-
268
 |
 |
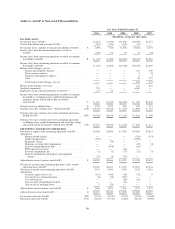
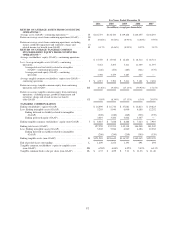
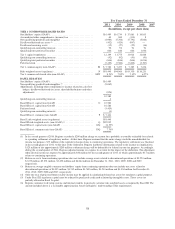
the interest income Regions receives on interest-earning assets, such as loans and securities, and the interest
expense Regions pays on interest-bearing liabilities, principally deposits and borrowings. Regions’ net interest
income is impacted by the size and mix of its balance sheet components and the interest rate spread between
interest earned on its assets and interest paid on its liabilities. Non-interest income includes fees from service
charges on deposit accounts, mortgage servicing and secondary marketing, trust and asset management activities,
insurance activities, capital markets and other customer services, which Regions provides. Results of operations
are also affected by the provision for loan losses and non-interest expenses such as salaries and employee
benefits, occupancy, professional fees, FDIC insurance, other real estate owned and other operating expenses, as
well as income taxes. In 2011, Regions’ non-interest expense from continuing operations included a $253 million
goodwill impairment charge related to the investment banking/brokerage/trust reporting unit. In 2010, Regions’
non-interest expense from continuing operations included a $75 million regulatory charge.
Economic conditions, competition, new legislation and related rules impacting regulation of the financial
services industry and the monetary and fiscal policies of the Federal government significantly affect financial
institutions, including Regions. Lending and deposit activities and fee income generation are influenced by levels
of business spending and investment, consumer income, consumer spending and savings, capital market
activities, and competition among financial institutions, as well as customer preferences, interest rate conditions
and prevailing market rates on competing products in Regions’ market areas.
Regions’ business strategy has been and continues to be focused on providing a competitive mix of products
and services, delivering quality customer service and maintaining a branch distribution network with offices in
convenient locations.
Dispositions
On January 11, 2012, Regions announced that it had entered into a stock purchase agreement to sell Morgan
Keegan to Raymond James Financial, Inc., for approximately $930 million in cash. As part of the transaction,
Morgan Keegan will also pay Regions a dividend of $250 million before closing, pending regulatory approvals,
resulting in total proceeds of approximately $1.18 billion to Regions subject to adjustment. The transaction is
anticipated to close around the end of the first quarter of 2012, subject to regulatory approvals and customary
closing conditions. Morgan Asset Management and Regions Morgan Keegan Trust are not included in the sale.
Results of operations for the entities being sold are presented separately as discontinued operations for all
periods presented on the consolidated statements of operations because the pending sale met all of the criteria for
reporting as discontinued operations at the December 31, 2011 balance sheet date. Refer to Note 3 “Discontinued
Operations” and Note 25 “Subsequent Event” for further details.
Business Segments
Regions provides traditional commercial, retail and mortgage banking services, as well as other financial
services in the fields of investment banking, asset management, trust, mutual funds, securities brokerage,
insurance and other specialty financing. Regions carries out its strategies and derives its profitability from the
following business segments:
Banking/Treasury
Regions’ primary business is providing traditional commercial, retail and mortgage banking services to its
customers. Regions’ banking subsidiary, Regions Bank, operates as an Alabama state-chartered bank with branch
offices in Alabama, Arkansas, Florida, Georgia, Illinois, Indiana, Iowa, Kentucky, Louisiana, Mississippi,
Missouri, North Carolina, South Carolina, Tennessee, Texas and Virginia. The Treasury function includes the
Company’s securities portfolio and other wholesale funding activities. In 2011, Regions’ banking and treasury
operations contributed $355 million of net income.
49