Regions Bank 2011 Annual Report Download - page 194
Download and view the complete annual report
Please find page 194 of the 2011 Regions Bank annual report below. You can navigate through the pages in the report by either clicking on the pages listed below, or by using the keyword search tool below to find specific information within the annual report.-
 1
1 -
2
-
3
-
4
-
5
-
6
-
7
-
8
-
9
-
10
-
11
-
12
-
13
-
14
-
15
-
16
-
17
-
18
-
19
-
20
-
21
-
22
-
23
-
24
-
25
-
26
-
27
-
28
-
29
-
30
-
31
-
32
-
33
-
34
-
35
-
36
-
37
-
38
-
39
-
40
-
41
-
42
-
43
-
44
-
45
-
46
-
47
-
48
-
49
-
50
-
51
-
52
-
53
-
54
-
55
-
56
-
57
-
58
-
59
-
60
-
61
-
62
-
63
-
64
-
65
-
66
-
67
-
68
-
69
-
70
-
71
-
72
-
73
-
74
-
75
-
76
-
77
-
78
-
79
-
80
-
81
-
82
-
83
-
84
-
85
-
86
-
87
-
88
-
89
-
90
-
91
-
92
-
93
-
94
-
95
-
96
-
97
-
98
-
99
-
100
-
101
-
102
-
103
-
104
-
105
-
106
-
107
-
108
-
109
-
110
-
111
-
112
-
113
-
114
-
115
-
116
-
117
-
118
-
119
-
120
-
121
-
122
-
123
-
124
-
125
-
126
-
127
-
128
-
129
-
130
-
131
-
132
-
133
-
134
-
135
-
136
-
137
-
138
-
139
-
140
-
141
-
142
-
143
-
144
-
145
-
146
-
147
-
148
-
149
-
150
-
151
-
152
-
153
-
154
-
155
-
156
-
157
-
158
-
159
-
160
-
161
-
162
-
163
-
164
-
165
-
166
-
167
-
168
-
169
-
170
-
171
-
172
-
173
-
174
-
175
-
176
-
177
-
178
-
179
-
180
-
181
-
182
-
183
-
 184
184 -
 185
185 -
 186
186 -
 187
187 -
 188
188 -
 189
189 -
 190
190 -
 191
191 -
 192
192 -
 193
193 -
 194
194 -
 195
195 -
 196
196 -
 197
197 -
 198
198 -
 199
199 -
 200
200 -
 201
201 -
 202
202 -
 203
203 -
 204
204 -
205
-
206
-
207
-
208
-
209
-
210
-
211
-
212
-
213
-
214
-
215
-
216
-
217
-
218
-
219
-
220
-
221
-
222
-
223
-
224
-
225
-
226
-
227
-
228
-
229
-
230
-
231
-
232
-
233
-
234
-
235
-
236
-
237
-
238
-
239
-
240
-
241
-
242
-
243
-
244
-
245
-
246
-
247
-
248
-
249
-
250
-
251
-
252
-
253
-
254
-
255
-
256
-
257
-
258
-
259
-
260
-
261
-
262
-
263
-
264
-
265
-
266
-
267
-
268
 |
 |

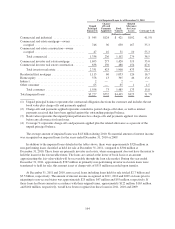
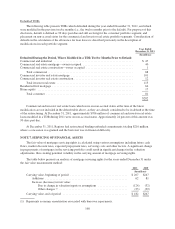
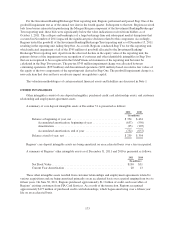
Regions maintains a repurchase liability related to mortgage loans sold with representations and warranty
provisions. This repurchase liability is reported in other liabilities on the consolidated balance sheets and reflects
management’s estimate of losses based on historical repurchase and loss trends, as well as other factors that may
result in anticipated losses different from historical loss trends. Adjustments to this reserve are recorded in other
non-interest expense on the consolidated statements of operations. The table below presents an analysis of
Regions’ repurchase liability, related to mortgage loans sold with representations and warranty provisions, for the
years ended December 31:
2011 2010
(In millions)
Beginning balance .............................................. $32 $30
Additions/(reductions), net .................................... 23 18
Losses .................................................... (23) (16)
Ending balance ................................................. $32 $32
During 2011, settled repurchase claims were related to one of the following alleged breaches: 1)
underwriting guideline violations; 2) misrepresentation of income, assets or employment; or 3) property
valuation not supported. These claims stem primarily from the 2006-2008 vintages.
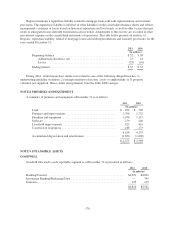
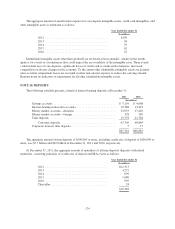
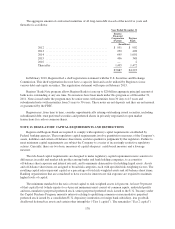
NOTE 8. PREMISES AND EQUIPMENT
A summary of premises and equipment at December 31 is as follows:
2011 2010
(In millions)
Land .................................................... $ 492 $ 509
Premises and improvements .................................. 1,706 1,722
Furniture and equipment ..................................... 1,106 1,115
Software ................................................. 279 240
Leasehold improvements .................................... 425 416
Construction in progress ..................................... 188 173
4,196 4,175
Accumulated depreciation and amortization ..................... (1,821) (1,606)
$ 2,375 $ 2,569
NOTE 9. INTANGIBLE ASSETS
GOODWILL
Goodwill allocated to each reportable segment as of December 31 is presented as follows:
2011 2010
(In millions)
Banking/Treasury ................................................... $4,691 $4,691
Investment Banking/Brokerage/Trust .................................... — 745
Insurance .......................................................... 125 125
$4,816 $5,561
170