Regions Bank 2011 Annual Report Download - page 219
Download and view the complete annual report
Please find page 219 of the 2011 Regions Bank annual report below. You can navigate through the pages in the report by either clicking on the pages listed below, or by using the keyword search tool below to find specific information within the annual report.-
 1
1 -
2
-
3
-
4
-
5
-
6
-
7
-
8
-
9
-
10
-
11
-
12
-
13
-
14
-
15
-
16
-
17
-
18
-
19
-
20
-
21
-
22
-
23
-
24
-
25
-
26
-
27
-
28
-
29
-
30
-
31
-
32
-
33
-
34
-
35
-
36
-
37
-
38
-
39
-
40
-
41
-
42
-
43
-
44
-
45
-
46
-
47
-
48
-
49
-
50
-
51
-
52
-
53
-
54
-
55
-
56
-
57
-
58
-
59
-
60
-
61
-
62
-
63
-
64
-
65
-
66
-
67
-
68
-
69
-
70
-
71
-
72
-
73
-
74
-
75
-
76
-
77
-
78
-
79
-
80
-
81
-
82
-
83
-
84
-
85
-
86
-
87
-
88
-
89
-
90
-
91
-
92
-
93
-
94
-
95
-
96
-
97
-
98
-
99
-
100
-
101
-
102
-
103
-
104
-
105
-
106
-
107
-
108
-
109
-
110
-
111
-
112
-
113
-
114
-
115
-
116
-
117
-
118
-
119
-
120
-
121
-
122
-
123
-
124
-
125
-
126
-
127
-
128
-
129
-
130
-
131
-
132
-
133
-
134
-
135
-
136
-
137
-
138
-
139
-
140
-
141
-
142
-
143
-
144
-
145
-
146
-
147
-
148
-
149
-
150
-
151
-
152
-
153
-
154
-
155
-
156
-
157
-
158
-
159
-
160
-
161
-
162
-
163
-
164
-
165
-
166
-
167
-
168
-
169
-
170
-
171
-
172
-
173
-
174
-
175
-
176
-
177
-
178
-
179
-
180
-
181
-
182
-
183
-
184
-
185
-
186
-
187
-
188
-
189
-
190
-
191
-
192
-
193
-
194
-
195
-
196
-
197
-
198
-
199
-
200
-
201
-
202
-
203
-
204
-
205
-
206
-
207
-
208
-
 209
209 -
 210
210 -
 211
211 -
 212
212 -
 213
213 -
 214
214 -
 215
215 -
 216
216 -
 217
217 -
 218
218 -
 219
219 -
 220
220 -
 221
221 -
 222
222 -
 223
223 -
 224
224 -
 225
225 -
 226
226 -
 227
227 -
 228
228 -
 229
229 -
230
-
231
-
232
-
233
-
234
-
235
-
236
-
237
-
238
-
239
-
240
-
241
-
242
-
243
-
244
-
245
-
246
-
247
-
248
-
249
-
250
-
251
-
252
-
253
-
254
-
255
-
256
-
257
-
258
-
259
-
260
-
261
-
262
-
263
-
264
-
265
-
266
-
267
-
268
 |
 |

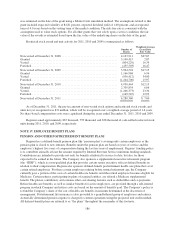
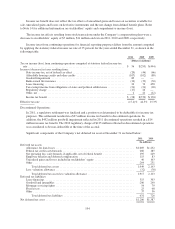
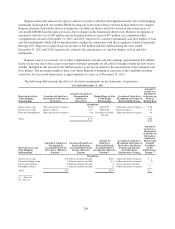
The following table provides details of the Company’s tax carryforwards at December 31, 2011, including
the expiration dates, any related valuation allowance and the amount of taxable earnings necessary to fully
realize each net deferred tax asset balance:
Expiration Dates
Deferred Tax
Asset Balance
Valuation
Allowance
Net Deferred
Tax Asset
Balance
Pre-Tax
Earnings
Necessary to
Realize(1)
(In millions)
General business credits-federal ........ 2029-2031 $239 $— $239 $ N/A
Alternative minimum tax
credits—federal ................... None(2) 21 — 21 N/A
Net operating losses-states ............ 2012-2016 17 (7) 10 227
Net operating losses-states ............ 2017-2023 82 (7) 75 1,781
Net operating losses-states ............ 2024-2031 96 (14) 82 2,060
Other credits-states .................. 2012-2016 6 (4) 2 N/A
(1) N/A indicates that credits are not measured on a pre-tax basis.
(2) Alternative minimum tax credits can be carried forward indefinitely.
The Company’s determination of the realization of the net deferred tax asset is based on its assessment of all
available positive and negative evidence. The Company is currently in a three-year cumulative loss position,
which represents negative evidence. Of the $1.3 billion net deferred tax asset, $429 million relates to net
operating losses and tax carryforwards of which $87 million expires before 2024 (as detailed in the table above).
The remaining $857 million of net deferred tax assets do not have a set expiration date at December 31, 2011.
At December 31, 2011, positive evidence supporting the realization of the deferred tax asset includes the
reversal of taxable temporary differences that will offset approximately $850 million of the gross deferred tax
asset. The Company has projected future taxable income over the next five tax years. Further positive evidence
includes the Company’s strong capital position and history of significant pre-tax earnings which the Company
believes outweighs the negative evidence of recent pre-tax losses.
The Company does not believe that a portion of the state net operating loss carryforwards and state tax
credit carryforwards will be realized due to the length of certain state carryforward periods. Accordingly, a
valuation allowance has been established in the amount of $32 million against such benefits at December 31,
2011 compared to $30 million at December 31, 2010. Except for certain state tax carryforwards, the Company
believes the net deferred tax asset is more-likely-than-not to be realized.
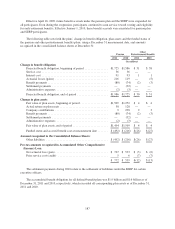
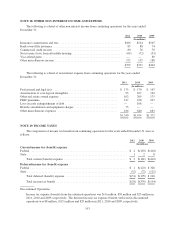
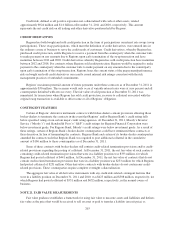
A reconciliation of the beginning and ending amount of unrecognized tax benefits (“UTBs”) is as follows:
2011 2010 2009
(In millions)
Balance at beginning of year .................................................. $38 $ 26 $ 55
Additions based on tax positions related to the current year ...................... 6 9 5
Additions based on tax positions taken in a prior period ......................... 10 32 14
Reductions based on tax positions taken in a prior period ....................... (10) (29) —
Settlements ............................................................ (3) — (48)
Expiration of statute of limitations ......................................... (2) — —
Balance at end of year ....................................................... $39 $ 38 $ 26
During 2010, the Internal Revenue Service (“IRS”) completed the field examination for the tax years 2007,
2008 and 2009 and issued Revenue Agent’s Reports to the Company. Included within these reports was a
proposed adjustment to the timing of deductions related to certain expenses. The Company has filed a protest
195