Regions Bank 2011 Annual Report Download - page 111
Download and view the complete annual report
Please find page 111 of the 2011 Regions Bank annual report below. You can navigate through the pages in the report by either clicking on the pages listed below, or by using the keyword search tool below to find specific information within the annual report.-
 1
1 -
2
-
3
-
4
-
5
-
6
-
7
-
8
-
9
-
10
-
11
-
12
-
13
-
14
-
15
-
16
-
17
-
18
-
19
-
20
-
21
-
22
-
23
-
24
-
25
-
26
-
27
-
28
-
29
-
30
-
31
-
32
-
33
-
34
-
35
-
36
-
37
-
38
-
39
-
40
-
41
-
42
-
43
-
44
-
45
-
46
-
47
-
48
-
49
-
50
-
51
-
52
-
53
-
54
-
55
-
56
-
57
-
58
-
59
-
60
-
61
-
62
-
63
-
64
-
65
-
66
-
67
-
68
-
69
-
70
-
71
-
72
-
73
-
74
-
75
-
76
-
77
-
78
-
79
-
80
-
81
-
82
-
83
-
84
-
85
-
86
-
87
-
88
-
89
-
90
-
91
-
92
-
93
-
94
-
95
-
96
-
97
-
98
-
99
-
100
-
 101
101 -
 102
102 -
 103
103 -
 104
104 -
 105
105 -
 106
106 -
 107
107 -
 108
108 -
 109
109 -
 110
110 -
 111
111 -
 112
112 -
 113
113 -
 114
114 -
 115
115 -
 116
116 -
 117
117 -
 118
118 -
 119
119 -
 120
120 -
 121
121 -
122
-
123
-
124
-
125
-
126
-
127
-
128
-
129
-
130
-
131
-
132
-
133
-
134
-
135
-
136
-
137
-
138
-
139
-
140
-
141
-
142
-
143
-
144
-
145
-
146
-
147
-
148
-
149
-
150
-
151
-
152
-
153
-
154
-
155
-
156
-
157
-
158
-
159
-
160
-
161
-
162
-
163
-
164
-
165
-
166
-
167
-
168
-
169
-
170
-
171
-
172
-
173
-
174
-
175
-
176
-
177
-
178
-
179
-
180
-
181
-
182
-
183
-
184
-
185
-
186
-
187
-
188
-
189
-
190
-
191
-
192
-
193
-
194
-
195
-
196
-
197
-
198
-
199
-
200
-
201
-
202
-
203
-
204
-
205
-
206
-
207
-
208
-
209
-
210
-
211
-
212
-
213
-
214
-
215
-
216
-
217
-
218
-
219
-
220
-
221
-
222
-
223
-
224
-
225
-
226
-
227
-
228
-
229
-
230
-
231
-
232
-
233
-
234
-
235
-
236
-
237
-
238
-
239
-
240
-
241
-
242
-
243
-
244
-
245
-
246
-
247
-
248
-
249
-
250
-
251
-
252
-
253
-
254
-
255
-
256
-
257
-
258
-
259
-
260
-
261
-
262
-
263
-
264
-
265
-
266
-
267
-
268
 |
 |

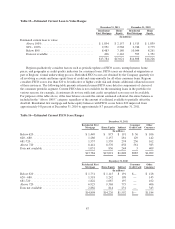
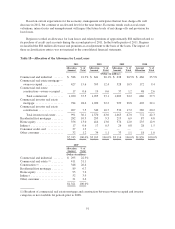
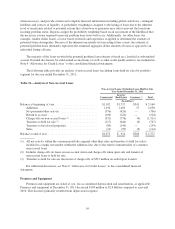
Table 15—Estimated Current Loan to Value Ranges
December 31, 2011 December 31, 2010
Residential
First Mortgage
Home
Equity
Residential
First Mortgage
Home
Equity
(In millions)
Estimated current loan to value:
Above 100% ................................... $ 1,854 $ 2,157 $ 1,515 $ 1,839
80% - 100% ................................... 2,951 2,568 2,746 2,775
Below 80% .................................... 8,483 7,180 10,044 8,261
Data not available .............................. 496 1,116 593 1,351
$13,784 $13,021 $14,898 $14,226
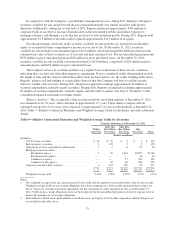
Regions qualitatively considers factors such as periodic updates of FICO scores, unemployment, home
prices, and geography as credit quality indicators for consumer loans. FICO scores are obtained at origination as
part of Regions’ formal underwriting process. Refreshed FICO scores are obtained by the Company quarterly for
all revolving accounts and home equity lines of credit and semi-annually for all other consumer loans. Regions
considers FICO scores less than 620 to be indicative of higher credit risk and obtains additional collateral in most
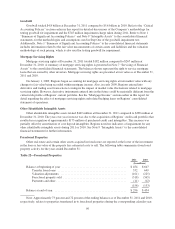
of these instances. The following table presents estimated current FICO score data for components of classes of
the consumer portfolio segment. Current FICO data is not available for the remaining loans in the portfolio for
various reasons; for example, if customers do not use sufficient credit, an updated score may not be available.
For purposes of the table above, if the loan balance exceeds the current estimated collateral, the entire balance is
included in the “Above 100%” category, regardless of the amount of collateral available to partially offset the
shortfall. Residential first mortgage and home equity balances with FICO scores below 620 improved from
approximately 9.8 percent at December 31, 2010 to approximately 8.7 percent at December 31, 2011.
Table 16—Estimated Current FICO Score Ranges
December 31, 2011
Residential First
Mortgage Home Equity Indirect
Consumer
Credit Card
Other
Consumer
(In millions)
Below 620 ............................... $ 1,449 $ 873 $ 191 $ 56 $ 106
620-680................................ 1,286 1,157 281 129 142
681-720 ................................. 1,557 1,559 274 236 162
Above 720 .............................. 8,441 8,576 858 561 383
Data not available ......................... 1,051 856 244 5 409
$13,784 $13,021 $1,848 $987 $1,202
December 31, 2010
Residential First
Mortgage Home Equity Indirect
Consumer
Credit Card
Other
Consumer
(In millions)
Below 620 ............................... $ 1,751 $ 1,115 $ 191 $— $ 128
620-680................................ 1,518 1,242 198 — 145
681-720 ................................. 1,822 1,687 197 — 162
Above 720 .............................. 6,925 9,368 775 — 406
Data not available ......................... 2,882 814 231 — 343
$14,898 $14,226 $1,592 $— $1,184
87