Regions Bank 2011 Annual Report Download - page 72
Download and view the complete annual report
Please find page 72 of the 2011 Regions Bank annual report below. You can navigate through the pages in the report by either clicking on the pages listed below, or by using the keyword search tool below to find specific information within the annual report.-
 1
1 -
2
-
3
-
4
-
5
-
6
-
7
-
8
-
9
-
10
-
11
-
12
-
13
-
14
-
15
-
16
-
17
-
18
-
19
-
20
-
21
-
22
-
23
-
24
-
25
-
26
-
27
-
28
-
29
-
30
-
31
-
32
-
33
-
34
-
35
-
36
-
37
-
38
-
39
-
40
-
41
-
42
-
43
-
44
-
45
-
46
-
47
-
48
-
49
-
50
-
51
-
52
-
53
-
54
-
55
-
56
-
57
-
58
-
59
-
60
-
61
-
 62
62 -
 63
63 -
 64
64 -
 65
65 -
 66
66 -
 67
67 -
 68
68 -
 69
69 -
 70
70 -
 71
71 -
 72
72 -
 73
73 -
 74
74 -
 75
75 -
 76
76 -
 77
77 -
 78
78 -
 79
79 -
 80
80 -
 81
81 -
 82
82 -
83
-
84
-
85
-
86
-
87
-
88
-
89
-
90
-
91
-
92
-
93
-
94
-
95
-
96
-
97
-
98
-
99
-
100
-
101
-
102
-
103
-
104
-
105
-
106
-
107
-
108
-
109
-
110
-
111
-
112
-
113
-
114
-
115
-
116
-
117
-
118
-
119
-
120
-
121
-
122
-
123
-
124
-
125
-
126
-
127
-
128
-
129
-
130
-
131
-
132
-
133
-
134
-
135
-
136
-
137
-
138
-
139
-
140
-
141
-
142
-
143
-
144
-
145
-
146
-
147
-
148
-
149
-
150
-
151
-
152
-
153
-
154
-
155
-
156
-
157
-
158
-
159
-
160
-
161
-
162
-
163
-
164
-
165
-
166
-
167
-
168
-
169
-
170
-
171
-
172
-
173
-
174
-
175
-
176
-
177
-
178
-
179
-
180
-
181
-
182
-
183
-
184
-
185
-
186
-
187
-
188
-
189
-
190
-
191
-
192
-
193
-
194
-
195
-
196
-
197
-
198
-
199
-
200
-
201
-
202
-
203
-
204
-
205
-
206
-
207
-
208
-
209
-
210
-
211
-
212
-
213
-
214
-
215
-
216
-
217
-
218
-
219
-
220
-
221
-
222
-
223
-
224
-
225
-
226
-
227
-
228
-
229
-
230
-
231
-
232
-
233
-
234
-
235
-
236
-
237
-
238
-
239
-
240
-
241
-
242
-
243
-
244
-
245
-
246
-
247
-
248
-
249
-
250
-
251
-
252
-
253
-
254
-
255
-
256
-
257
-
258
-
259
-
260
-
261
-
262
-
263
-
264
-
265
-
266
-
267
-
268
 |
 |
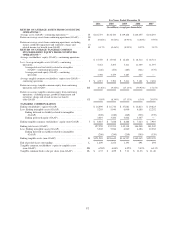
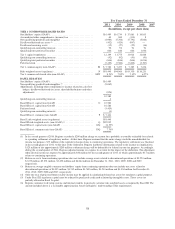
• Interest Rate Risk—In 2011, the net interest margin from continuing operations expanded to 3.07
percent from 2.91 percent in 2010, largely due to a mix shift from time deposits to lower cost deposit
products, resulting in deposit costs decreasing to 0.49 percent in 2011 from 0.78 percent in 2010.
However, the margin continues to be negatively affected by a persistently low interest rate
environment, elevated non-performing asset levels, and elevated cash levels. Loan yields remained
stable at 4.31 percent as the Company began to see the benefits from migrating toward more consumer
products, such as re-entering credit cards and indirect auto lending. However, the Company’s securities
yield declined 58 basis points driven by higher prepayments in its agency guaranteed residential
mortgage-backed securities portfolio and reinvesting proceeds into lower yielding securities. The
Company decreased the duration of the securities portfolio to 2.1 years as of December 31, 2011 from
3.4 years as of December 31, 2010. Management expects to see incremental improvement in net
interest income and the resulting net interest margin in 2012 as the amount of cash at the Federal
Reserve and non-performing assets continue to decline. Furthermore, Regions’ balance sheet is in an
asset sensitive position such that if economic conditions were to improve more rapidly, thereby
resulting in a rise in interest rates, the net interest margin would likely respond favorably. For more
information, refer to the following additional sections within this Form 10-K:
• 2011 Overview discussion in MD&A
• Net Interest Income and Margin section of MD&A
• Interest Rate Risk section of MD&A
• Regulatory Capital—Regions’ ability to maintain appropriate levels of capital is critical to its safety
and soundness. At December 31, 2011, Regions’ Tier 1 capital and Tier 1 common (non-GAAP) ratios
were 13.28 percent and 8.51 percent, respectively. The corresponding Basel III ratios (non-GAAP)
based on Regions’ current understanding of the guidelines are 11.39 percent and 7.70 percent,
respectively. These ratios are above the respective Basel III minimums of 8.5 percent and 7 percent.
Regions’ capital planning process is executed by management, overseen by the Board of Directors, and
supervised by banking regulators. The process utilizes a base case, multiple adverse cases and a growth
forecast. In early 2012, as part of the required Comprehensive Capital Analysis and Review (“CCAR”),
Regions submitted four scenarios including the company’s baseline forecast, the Federal Reserve’s
baseline outlook, the company’s stress case and the Federal Reserve’s stress case. Regions expects to
receive its results from the Federal Reserve by the middle of March 2012. The Federal Reserve intends
to publish the results of the supervisory stress test component of the CCAR for Regions and all
companies that participated. For more information, refer to the following additional sections within this
Form 10-K:
• 2011 Overview discussion in MD&A
• Table 2 – “GAAP to Non-GAAP reconciliation”
• Bank Regulatory Capital Requirements section of MD&A
• Note 13 “Regulatory Capital Requirements and Restrictions” to the consolidated financial
statements
GENERAL
The following discussion and financial information is presented to aid in understanding Regions’ financial
position and results of operations. The emphasis of this discussion will be on continuing operations for the years
2011, 2010 and 2009; in addition, financial information for prior years will also be presented when appropriate.
Certain amounts in prior year presentations have been reclassified to conform to the current year presentation,
except as otherwise noted.
Regions’ profitability, like that of many other financial institutions, is dependent on its ability to generate
revenue from net interest income and non-interest income sources. Net interest income is the difference between
48