Regions Bank 2011 Annual Report Download - page 82
Download and view the complete annual report
Please find page 82 of the 2011 Regions Bank annual report below. You can navigate through the pages in the report by either clicking on the pages listed below, or by using the keyword search tool below to find specific information within the annual report.-
 1
1 -
2
-
3
-
4
-
5
-
6
-
7
-
8
-
9
-
10
-
11
-
12
-
13
-
14
-
15
-
16
-
17
-
18
-
19
-
20
-
21
-
22
-
23
-
24
-
25
-
26
-
27
-
28
-
29
-
30
-
31
-
32
-
33
-
34
-
35
-
36
-
37
-
38
-
39
-
40
-
41
-
42
-
43
-
44
-
45
-
46
-
47
-
48
-
49
-
50
-
51
-
52
-
53
-
54
-
55
-
56
-
57
-
58
-
59
-
60
-
61
-
62
-
63
-
64
-
65
-
66
-
67
-
68
-
69
-
70
-
71
-
 72
72 -
 73
73 -
 74
74 -
 75
75 -
 76
76 -
 77
77 -
 78
78 -
 79
79 -
 80
80 -
 81
81 -
 82
82 -
 83
83 -
 84
84 -
 85
85 -
 86
86 -
 87
87 -
 88
88 -
 89
89 -
 90
90 -
 91
91 -
 92
92 -
93
-
94
-
95
-
96
-
97
-
98
-
99
-
100
-
101
-
102
-
103
-
104
-
105
-
106
-
107
-
108
-
109
-
110
-
111
-
112
-
113
-
114
-
115
-
116
-
117
-
118
-
119
-
120
-
121
-
122
-
123
-
124
-
125
-
126
-
127
-
128
-
129
-
130
-
131
-
132
-
133
-
134
-
135
-
136
-
137
-
138
-
139
-
140
-
141
-
142
-
143
-
144
-
145
-
146
-
147
-
148
-
149
-
150
-
151
-
152
-
153
-
154
-
155
-
156
-
157
-
158
-
159
-
160
-
161
-
162
-
163
-
164
-
165
-
166
-
167
-
168
-
169
-
170
-
171
-
172
-
173
-
174
-
175
-
176
-
177
-
178
-
179
-
180
-
181
-
182
-
183
-
184
-
185
-
186
-
187
-
188
-
189
-
190
-
191
-
192
-
193
-
194
-
195
-
196
-
197
-
198
-
199
-
200
-
201
-
202
-
203
-
204
-
205
-
206
-
207
-
208
-
209
-
210
-
211
-
212
-
213
-
214
-
215
-
216
-
217
-
218
-
219
-
220
-
221
-
222
-
223
-
224
-
225
-
226
-
227
-
228
-
229
-
230
-
231
-
232
-
233
-
234
-
235
-
236
-
237
-
238
-
239
-
240
-
241
-
242
-
243
-
244
-
245
-
246
-
247
-
248
-
249
-
250
-
251
-
252
-
253
-
254
-
255
-
256
-
257
-
258
-
259
-
260
-
261
-
262
-
263
-
264
-
265
-
266
-
267
-
268
 |
 |

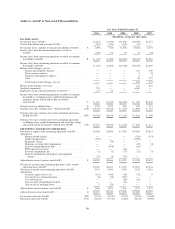
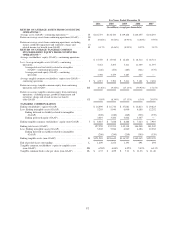
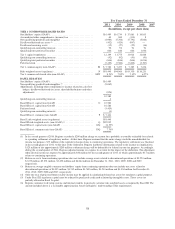
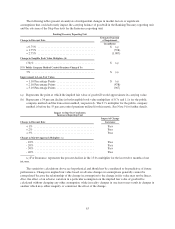
For Years Ended December 31
2011 2010 2009 2008 2007
(In millions, except per share data)
TIER 1 COMMON RISK-BASED RATIO
Stockholders’ equity (GAAP) ................................... $16,499 $16,734 $ 17,881 $ 16,813
Accumulated other comprehensive (income) loss ................... 69 260 (130) 8
Non-qualifying goodwill and intangibles .......................... (4,900) (5,706) (5,792) (5,864)
Disallowed deferred tax assets (4) ................................ (432) (424) (947) —
Disallowed servicing assets .................................... (35) (27) (25) (16)
Qualifying non-controlling interests .............................. 92 92 91 91
Qualifying trust preferred securities .............................. 846 846 846 1,036
Tier 1 capital (regulatory) ...................................... 12,139 11,775 11,924 12,068
Qualifying non-controlling interests .............................. (92) (92) (91) (91)
Qualifying trust preferred securities .............................. (846) (846) (846) (1,036)
Preferred stock .............................................. (3,419) (3,380) (3,602) (3,307)
Tier 1 common equity (non-GAAP) .............................. M $ 7,782 $ 7,457 $ 7,385 $ 7,634
Risk-weighted assets (regulatory) ................................ N $91,449 $94,966 $103,330 $116,251
Tier 1 common risk-based ratio (non-GAAP) ...................... M/N 8.51% 7.85% 7.15% 6.57%
BASEL III RATIOS
Stockholders’ equity (GAAP) ................................... $16,499
Non-qualifying goodwill and intangibles (5) ........................ (5,065)
Adjustments, including other comprehensive income related to cash flow
hedges, disallowed deferred tax assets, threshold deductions and other
adjustments ............................................... (854)
10,580
Qualifying non-controlling interests .............................. 4
Basel III tier 1 capital (non-GAAP) .............................. O 10,584
Basel III tier 1 capital (non-GAAP) .............................. 10,584
Preferred stock .............................................. (3,419)
Qualifying non-controlling interests .............................. (4)
Basel III tier 1 common (non-GAAP) ............................. P $ 7,161
Basel I risk-weighted assets (regulatory) .......................... $91,449
Basel III risk-weighted assets (non-GAAP) (6) ...................... Q $92,935
Basel III tier 1 capital ratio (non-GAAP) .......................... O/Q 11.39%
Basel III tier 1 common ratio (non-GAAP) ........................ P/Q 7.70%
(1) In the second quarter of 2010, Regions recorded a $200 million charge to account for a probable, reasonably estimable loss related
to a pending settlement of regulatory matters. At that time, Regions assumed that the entire charge would be non-deductible for
income tax purposes. $75 million of the regulatory charge relates to continuing operations. The regulatory settlement was finalized
in the second quarter of 2011. At the time of the settlement, Regions had better information related to the income tax implications.
$125 million of the approximately $200 million settlement charge will be deductible for federal income tax purposes. Accordingly,
during the second quarter of 2011, Regions adjusted income tax expense to account for the impact of the deduction. The adjustment
reduced total income tax expense by approximately $44 million for the second quarter of 2011, of which approximately $17 million
relates to continuing operations.
(2) Return on assets from continuing operations does not include average assets related to discontinued operations of $3,254 million,
$3,235 million, $3,291 million, $3,492 million and $4,064 million for December 31, 2011, 2010, 2009, 2008 and 2007,
respectively.
(3) Return on average tangible common stockholders’ equity from continuing operations does not include net assets related to
discontinued operations of $1,035 million, $1,512 million, $1,569 million, $1,514 million and $1,304 million for December 31,
2011, 2010, 2009, 2008 and 2007, respectively.
(4) Only one year of projected future taxable income may be applied in calculating deferred tax assets for regulatory capital purposes.
(5) Under Basel III, regulatory capital must be reduced by purchased credit card relationship intangible assets. These assets are
partially allowed in Basel I capital.
(6) Regions continues to develop systems and internal controls to precisely calculate risk-weighted assets as required by Basel III. The
amount included above is a reasonable approximation, based on Regions’ understanding of the requirements.
58