Regions Bank 2011 Annual Report Download - page 231
Download and view the complete annual report
Please find page 231 of the 2011 Regions Bank annual report below. You can navigate through the pages in the report by either clicking on the pages listed below, or by using the keyword search tool below to find specific information within the annual report.-
 1
1 -
2
-
3
-
4
-
5
-
6
-
7
-
8
-
9
-
10
-
11
-
12
-
13
-
14
-
15
-
16
-
17
-
18
-
19
-
20
-
21
-
22
-
23
-
24
-
25
-
26
-
27
-
28
-
29
-
30
-
31
-
32
-
33
-
34
-
35
-
36
-
37
-
38
-
39
-
40
-
41
-
42
-
43
-
44
-
45
-
46
-
47
-
48
-
49
-
50
-
51
-
52
-
53
-
54
-
55
-
56
-
57
-
58
-
59
-
60
-
61
-
62
-
63
-
64
-
65
-
66
-
67
-
68
-
69
-
70
-
71
-
72
-
73
-
74
-
75
-
76
-
77
-
78
-
79
-
80
-
81
-
82
-
83
-
84
-
85
-
86
-
87
-
88
-
89
-
90
-
91
-
92
-
93
-
94
-
95
-
96
-
97
-
98
-
99
-
100
-
101
-
102
-
103
-
104
-
105
-
106
-
107
-
108
-
109
-
110
-
111
-
112
-
113
-
114
-
115
-
116
-
117
-
118
-
119
-
120
-
121
-
122
-
123
-
124
-
125
-
126
-
127
-
128
-
129
-
130
-
131
-
132
-
133
-
134
-
135
-
136
-
137
-
138
-
139
-
140
-
141
-
142
-
143
-
144
-
145
-
146
-
147
-
148
-
149
-
150
-
151
-
152
-
153
-
154
-
155
-
156
-
157
-
158
-
159
-
160
-
161
-
162
-
163
-
164
-
165
-
166
-
167
-
168
-
169
-
170
-
171
-
172
-
173
-
174
-
175
-
176
-
177
-
178
-
179
-
180
-
181
-
182
-
183
-
184
-
185
-
186
-
187
-
188
-
189
-
190
-
191
-
192
-
193
-
194
-
195
-
196
-
197
-
198
-
199
-
200
-
201
-
202
-
203
-
204
-
205
-
206
-
207
-
208
-
209
-
210
-
211
-
212
-
213
-
214
-
215
-
216
-
217
-
218
-
219
-
220
-
 221
221 -
 222
222 -
 223
223 -
 224
224 -
 225
225 -
 226
226 -
 227
227 -
 228
228 -
 229
229 -
 230
230 -
 231
231 -
 232
232 -
 233
233 -
 234
234 -
 235
235 -
 236
236 -
 237
237 -
 238
238 -
 239
239 -
 240
240 -
 241
241 -
242
-
243
-
244
-
245
-
246
-
247
-
248
-
249
-
250
-
251
-
252
-
253
-
254
-
255
-
256
-
257
-
258
-
259
-
260
-
261
-
262
-
263
-
264
-
265
-
266
-
267
-
268
 |
 |

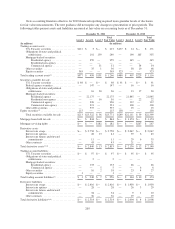
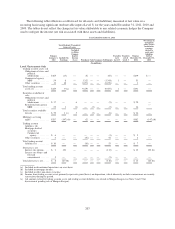
The following tables illustrate a rollforward for all assets and (liabilities) measured at fair value on a
recurring basis using significant unobservable inputs (Level 3) for the years ended December 31, 2011, 2010 and
2009. The tables do not reflect the change in fair value attributable to any related economic hedges the Company
used to mitigate the interest rate risk associated with these assets and (liabilities).
Year Ended December 31, 2011
Balance
January 1,
2011
Total Realized /Unrealized
Gains or Losses
Net change in
unrealized
gains (losses)
included in
earnings
related to
assets and
liabilities
held at
December 31,
2011
Included in
Earnings
Included
in Other
Compre-
hensive
Income
(Loss) Purchases Sales Issuances Settlements
Transfers
in to
Level 3
Transfers
out of
Level 3
Balance
December 31,
2011
(In millions)
Level 3 Instruments Only
Trading account assets: (d)
Obligations of states and
political
subdivisions ........ $165 (17) — 56 — — (65) — — $139 $ —
Commercial agency
MBS ............. 54 8 — 1,352 — — (1,364) 1 — 51 —
Other securities ....... 10 18 — 8,051 — — (8,078) — — 1 —
Total trading account
assets (e) ............ $229 9 (a) — 9,459 — — (9,507) 1 — $191 —
Securities available for
sale:
Obligations of states and
political
subdivisions ........ $ 17 — 6 — — — (3) — — $ 20 —
Residential non-agency
MBS ............. 22 1 (1) — (3) — (3) — — 16
—
Total securities available
for sale .............. $ 39 1(c) 5 — (3) — (6) — — $ 36 —
Mortgage servicing
rights ............... $267 (147) (b) — 62 — — — — — $182 (147) (b)
Trading account
liabilities: (d)
Mortgage-backed
securities:
Commercial
agency .......... $ 6 — — — — — (1) — — $ 5 —
Other securities ....... 4 — — (56) — — 54 — — 2 —
Total trading account
liabilities (e) ......... $ 10 — — (56) — — 53 — — $ 7 —
Derivatives, net:
Interest rate options .... $ 3 123 — — — — (113) — — $ 13 123 (b)
Interest rate futures and
forward
commitments ....... 5 — — — — — (5) — — — —
Total derivatives, net ..... $ 8 123(b) — — — — (118) — — $ 13 123 (b)
(a) Included in discontinued operations, on a net basis.
(b) Included in mortgage income.
(c) Included in other non-interest income.
(d) Income from trading account assets primarily represents gains/(losses) on disposition, which inherently includes commissions on security
transactions during the period.
(e) All amounts related to trading account assets and trading account liabilities are related to Morgan Keegan (see Note 3 and 25 for
discussion of pending sale of Morgan Keegan).
207