Regions Bank 2011 Annual Report Download - page 98
Download and view the complete annual report
Please find page 98 of the 2011 Regions Bank annual report below. You can navigate through the pages in the report by either clicking on the pages listed below, or by using the keyword search tool below to find specific information within the annual report.-
 1
1 -
2
-
3
-
4
-
5
-
6
-
7
-
8
-
9
-
10
-
11
-
12
-
13
-
14
-
15
-
16
-
17
-
18
-
19
-
20
-
21
-
22
-
23
-
24
-
25
-
26
-
27
-
28
-
29
-
30
-
31
-
32
-
33
-
34
-
35
-
36
-
37
-
38
-
39
-
40
-
41
-
42
-
43
-
44
-
45
-
46
-
47
-
48
-
49
-
50
-
51
-
52
-
53
-
54
-
55
-
56
-
57
-
58
-
59
-
60
-
61
-
62
-
63
-
64
-
65
-
66
-
67
-
68
-
69
-
70
-
71
-
72
-
73
-
74
-
75
-
76
-
77
-
78
-
79
-
80
-
81
-
82
-
83
-
84
-
85
-
86
-
87
-
 88
88 -
 89
89 -
 90
90 -
 91
91 -
 92
92 -
 93
93 -
 94
94 -
 95
95 -
 96
96 -
 97
97 -
 98
98 -
 99
99 -
 100
100 -
 101
101 -
 102
102 -
 103
103 -
 104
104 -
 105
105 -
 106
106 -
 107
107 -
 108
108 -
109
-
110
-
111
-
112
-
113
-
114
-
115
-
116
-
117
-
118
-
119
-
120
-
121
-
122
-
123
-
124
-
125
-
126
-
127
-
128
-
129
-
130
-
131
-
132
-
133
-
134
-
135
-
136
-
137
-
138
-
139
-
140
-
141
-
142
-
143
-
144
-
145
-
146
-
147
-
148
-
149
-
150
-
151
-
152
-
153
-
154
-
155
-
156
-
157
-
158
-
159
-
160
-
161
-
162
-
163
-
164
-
165
-
166
-
167
-
168
-
169
-
170
-
171
-
172
-
173
-
174
-
175
-
176
-
177
-
178
-
179
-
180
-
181
-
182
-
183
-
184
-
185
-
186
-
187
-
188
-
189
-
190
-
191
-
192
-
193
-
194
-
195
-
196
-
197
-
198
-
199
-
200
-
201
-
202
-
203
-
204
-
205
-
206
-
207
-
208
-
209
-
210
-
211
-
212
-
213
-
214
-
215
-
216
-
217
-
218
-
219
-
220
-
221
-
222
-
223
-
224
-
225
-
226
-
227
-
228
-
229
-
230
-
231
-
232
-
233
-
234
-
235
-
236
-
237
-
238
-
239
-
240
-
241
-
242
-
243
-
244
-
245
-
246
-
247
-
248
-
249
-
250
-
251
-
252
-
253
-
254
-
255
-
256
-
257
-
258
-
259
-
260
-
261
-
262
-
263
-
264
-
265
-
266
-
267
-
268
 |
 |
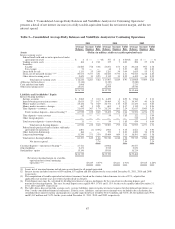
Salaries and Employee Benefits
Total salaries and employee benefits decreased $36 million, or 2 percent, in 2011. The year-over-year
decrease in salaries and employee benefits cost was primarily due to lower headcount and lower pension costs.
At December 31, 2011, Regions had 26,813 employees compared to 27,829 at December 31, 2010. Excluding
Morgan Keegan associates, there were 23,707 and 24,656 employees at the end of 2011 and 2010, respectively.
Regions provides employees who meet established employment requirements with a benefits package that
includes 401(k), pension, and medical, life and disability insurance plans. The pension plan has been closed to
new enrollments since 2006. Regions’ 401(k) plan includes a Company match of eligible employee
contributions. See Note 17 “Employee Benefit Plans” to the consolidated financial statements for further details.
There are various incentive plans in place in many of Regions’ lines of business that are tied to the
performance levels of employees. In general, incentives are used to reward employees for selling products and
services, for productivity improvements and for achievement of corporate financial goals. These achievements
are determined through a review of profitability and risk management. Regions’ long-term incentive plan
provides for the granting of stock options, restricted stock, restricted stock units and performance shares. See
Note 16 “Share-Based Payments” to the consolidated financial statements for further information.
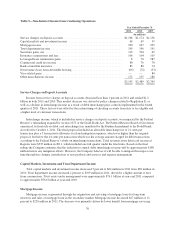
Net Occupancy Expense
Net occupancy expense includes rents, depreciation and amortization, utilities, maintenance, insurance,
taxes, and other expenses of premises occupied by Regions and its affiliates. Net occupancy expense decreased
$23 million, or 6 percent, in 2011. Rent expense decreased as a result of branch consolidation that occurred in
early 2010 and late 2011, as well as a result of other lease downsizing efforts. At December 31, 2011, Regions
had 1,726 branches compared to 1,772 at December 31, 2010. In 2011, Regions eliminated approximately
700,000 square feet of excess facilities space.
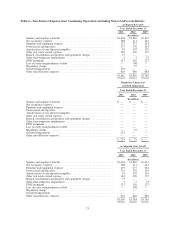
Furniture and Equipment Expense
Furniture and equipment expense decreased modestly by 1 percent to $275 million in 2011 primarily driven
by branch consolidations.
Professional and Legal Fees
Professional and legal fees are comprised of amounts related to legal, consulting and other professional fees.
These fees increased $5 million to $175 million in 2011, reflecting a 3 percent increase in the level of legal
expenses and credit-related legal costs in 2011. Refer to Note 23 “Commitments, Contingencies and Guarantees”
to the consolidated financial statements for additional information.
Amortization of Core Deposit Intangibles
The premium paid for core deposits in an acquisition is considered to be an intangible asset that is amortized
on an accelerated basis over its useful life. As a result, amortization of core deposit intangibles decreased 11
percent to $95 million in 2011 compared to $107 million in 2010.
Other Real Estate Owned Expense
Other real estate owned (“OREO”) expenses include the cost of adjusting foreclosed properties to fair value
after these assets have been classified as OREO and net gains and losses on sales of properties, as well as other
costs to maintain the property such as property taxes, security, and grounds maintenance. Through Regions’
efforts to sell foreclosed properties, OREO balances decreased $158 million to $296 million in 2011. This
reduction in OREO balances, along with lower valuation charges, was the primary driver of the $47 million
decline in OREO expense in 2011. See the “Foreclosed Properties” section later in the Balance Sheet Analysis.
74